Exclusive Real-Time Data
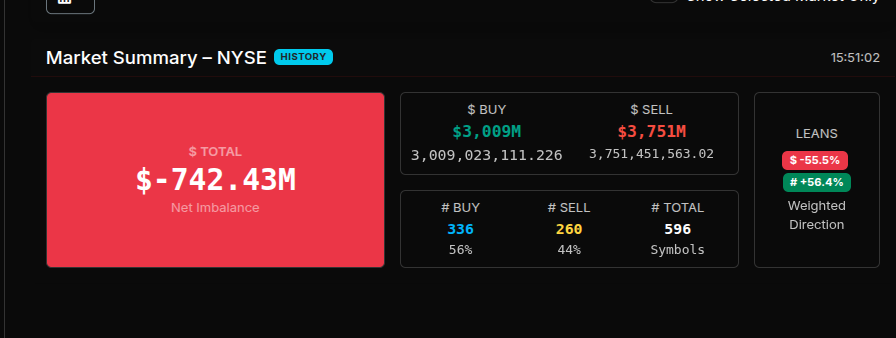
During the hour and a half before the markets open and the last ten minutes of the day, institutions are preparing their trades for the open and the close. It is arguable that the open and close are the most important trades of the day. It is a point in time where all the buyers and sellers for the day must be satisfied in a single auction. One big trade, with price discovery between bullish and bearish forces—unlike intraday price discovery. The MiM gives you front row seats to watch this auction in real-time
- • Quick glance view of current NYSE imbalances
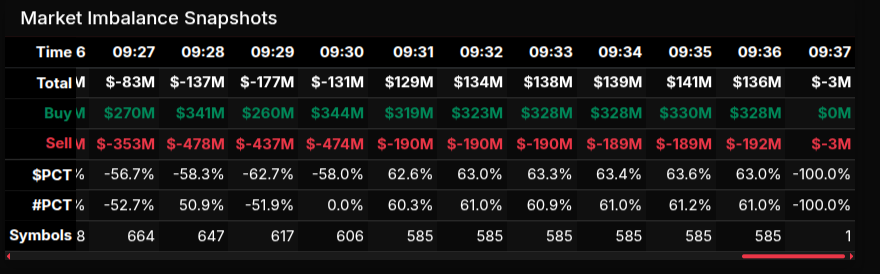
- • Timed snapshots to view imbalance trends
- • Index breakdowns to see effects on each index
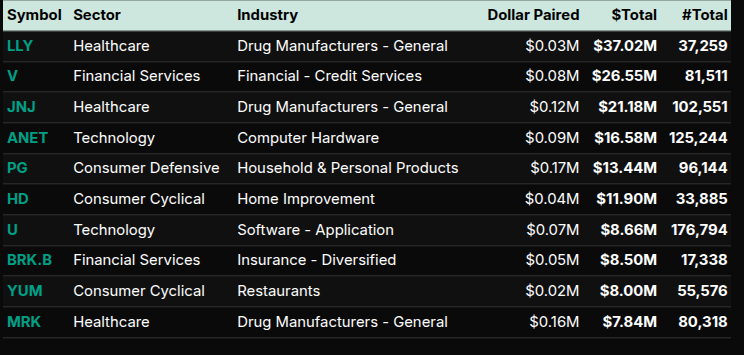
- • Leaderboard of top 10 symbols by dollar value imbalances