Our View
Thursday’s action was like the market trying to find its footing. After the ES shed ~92 points on Wednesday, the market gave a little to like for both sides yesterday.
Bears are happy the S&P wasn’t able to make up much ground or sustain any upside rallies. Bulls are happy the S&P found its footing on the 50-day and stopped going down.
The Nasdaq had a similar session, closing about flat on the day after neither the sellers nor the buyers could sustain momentum in their respective direction.
Rates remain the driving force. Yesterday we outlined what the probabilities of rate hikes look like this year, but it’s clear there is still some confusion when we look at various bonds — 2-year vs. 10-year, etc. — and the stock market.
The Fed is raising rates, plain and simple. The question now becomes, how much air needs to come out of the market to account for what will still be historically-low rates?
With the Fed watching the labor market as one of its main rate-hiking metrics, today’s non-farm payrolls report will be a key indicator.
Our Lean
The slippery action of the past few days has not made life easy. Nor has the Fed. However, not all hope is lost here. Specifically, I want to see if the ES and NQ can clear Thursday’s high and sustain above those highs.
To have an indecision day as we did on Thursday, then a rotation above those highs would bode well for bulls. We need to see rates lose some momentum, too.
On the flip side, a loss of yesterday’s low that isn’t reclaimed doesn’t bode well for bulls. Nor does taking out the high and failing to hold above it.
There is one day left in the “First Five Days of January” measure. The S&P 500 needs to gain 1.49% to have a green start to the year.
That’s a tough ask, but if anything can get it there, it may be a monthly labor report.
We don’t have to have a green finish here, but when combined with other December/January measures, it would go a long way to increasing the odds of a strong year. If it happens, we will publish the statistics on Monday.
Remember though, a notable pullback this year is not off the table.
Daily Recap
Thursday wasn’t quite a “no day,” but there wasn’t a ton of action to lean on. The ES opened at 4687.25 and charged higher out of the gate. It took out the overnight high at 4703 and ran to an early high of 4712 shortly after the open.
However, the gains were short-lived as the ES pulled back, tumbled below 4700, and faded below the opening price. It closed near 4678 at 10 am and bottomed shortly after at 4662.
The good news for bulls? This ended up being the session low after the ES bounced back. The bad news? The ES couldn’t really garner much upside momentum for the rest of the day.
The S&P futures slowly ground higher, with each rally being met with some back-and-fill. Eventually, it pushed through the initial morning high, hitting 4715.75 just before 1 p.m.
From there, the ES pulled back 20 to 25 handles to the 4690s, rallied to a lower high at 4709.50 after 3:00, and pulled back 30 points down to 4679. It was volatile on the close despite a muted MIM, with the ES coming into 3:50 at 4687, falling 8 points to 4678.75, rallying 12 points to 4691, then settling the 10-minute candle where it opened at 3:50, at 4687.
The ES settled at 4693.75 on the 5 p.m. futures close, up 1.75 points or 0.04%.
In the End
The final stat line made this close to a “no day” unless you were able to trade some of the intraday rips and dips.
In terms of the ES’s overall tone, it was weak out of the gate but firmed up after it found a low. In terms of the ES’s overall trade, volume was slightly higher than the prior session, at 1.809 million contracts.
As we all know, there’s no crystal ball when it comes to trading stocks, options, or futures. But the Market Imbalance Meter may be as close as it comes. Knowing how the “Big Money” is placing its bets can give our trading room a big wave to ride — or a warning sign to stay out of the water. Come check it out now, risk-free for 30 days.
Technical Breakdown
- NYSE Breadth: 63.6% upside volume
- NASDAQ Breadth: 50.5% upside volume
Thursday’s breadth figures mimic what we saw in the price action. Neither direction could sustain momentum and we were left with a doji candle on the S&P and Nasdaq. The former comes at the 50-day, while the latter searches for a low amid rising rates (and is the most affected, of the three major indices).
Today is the non-farm payrolls report for December and it’s usually a market-mover.
With the Fed eying the labor market (according to them, anyway), it’s even more likely to have an impact on the end-of-day readings.
The overall trend remains with the bulls, but today’s action could have an altering impact on that observation. Don’t dig in your heels if you find yourself on the wrong side of the action.
I am keeping my positions a bit smaller and working with smaller timeframes to capture any opportunity.
Game Plan
I talk repeatedly about knowing your environment — striking when the iron is hot and knowing when to back off. Right now, we are more defensive overall until a more clear trend emerges.
There is no point in engaging with low-quality setups.
That said, I am also keeping an eye on the list we compiled yesterday of top stock setups. As the market continues to gyrate, the list is getting smaller, and what we lose in quantity, we can gain in quality.
S&P 500

Sitting on the 50-day with a doji candle, let’s see if the S&P 500 can regain any momentum.
A daily-up over 4725 puts the 10-day back in play and would get the index back above all of its short-term daily moving averages and the 4718 resistance level.
A daily-down rotation below the 50-day could eventually put uptrend support (blue line) and the 21-week moving average in play.
The caveat in both cases is a rotation above or below these respective levels that’s quickly reversed — aka, a stop run. Watch yesterday’s high and low carefully to see how the S&P reacts to them.
Nasdaq

If the QQQ can get a sustainable daily-up rotation, it could put that cluster of moving averages in play, up above $390.
The key here is a favorable NFP reaction and a dip in rates. Without both, the Nasdaq faces headwinds in the short term, not tailwinds.
Below last month’s low near $377.50 and $374 could be on deck next.
Remember, we had a larger analysis of the Nasdaq over multiple timeframes yesterday.
Individual Stocks — A Go-To List & BABA
Here’s our evolving list of go-to names as the market looks to find its footing. It’s not too much to do the charts, but it can be overwhelming and drag out the newsletter. What do you think? (Leave a comment or reply to the newsletter if you can! I would appreciate the feedback.)
- Charts, watchlist or a mix of both?
Energy stocks have been incredibly robust. COP, PXD, XOM — you name it. These are go-to buy-the-dip stocks as long as oil has a bid. Banks have been pretty solid as well (as they benefit from a bump in rates).
Others include:
- BLDR
- F — robust strength. Like the market isn’t even struggling.
- CVS
- ABBV
- TD
- PG — strong but tired?
- MU — one of the few tech stocks still holding up; recently made new ATHs
- RACE — $257 to $260 is key downside area to hold (held yesterday)
- KO (defensive)
- MDLZ (defensive)
Alibaba
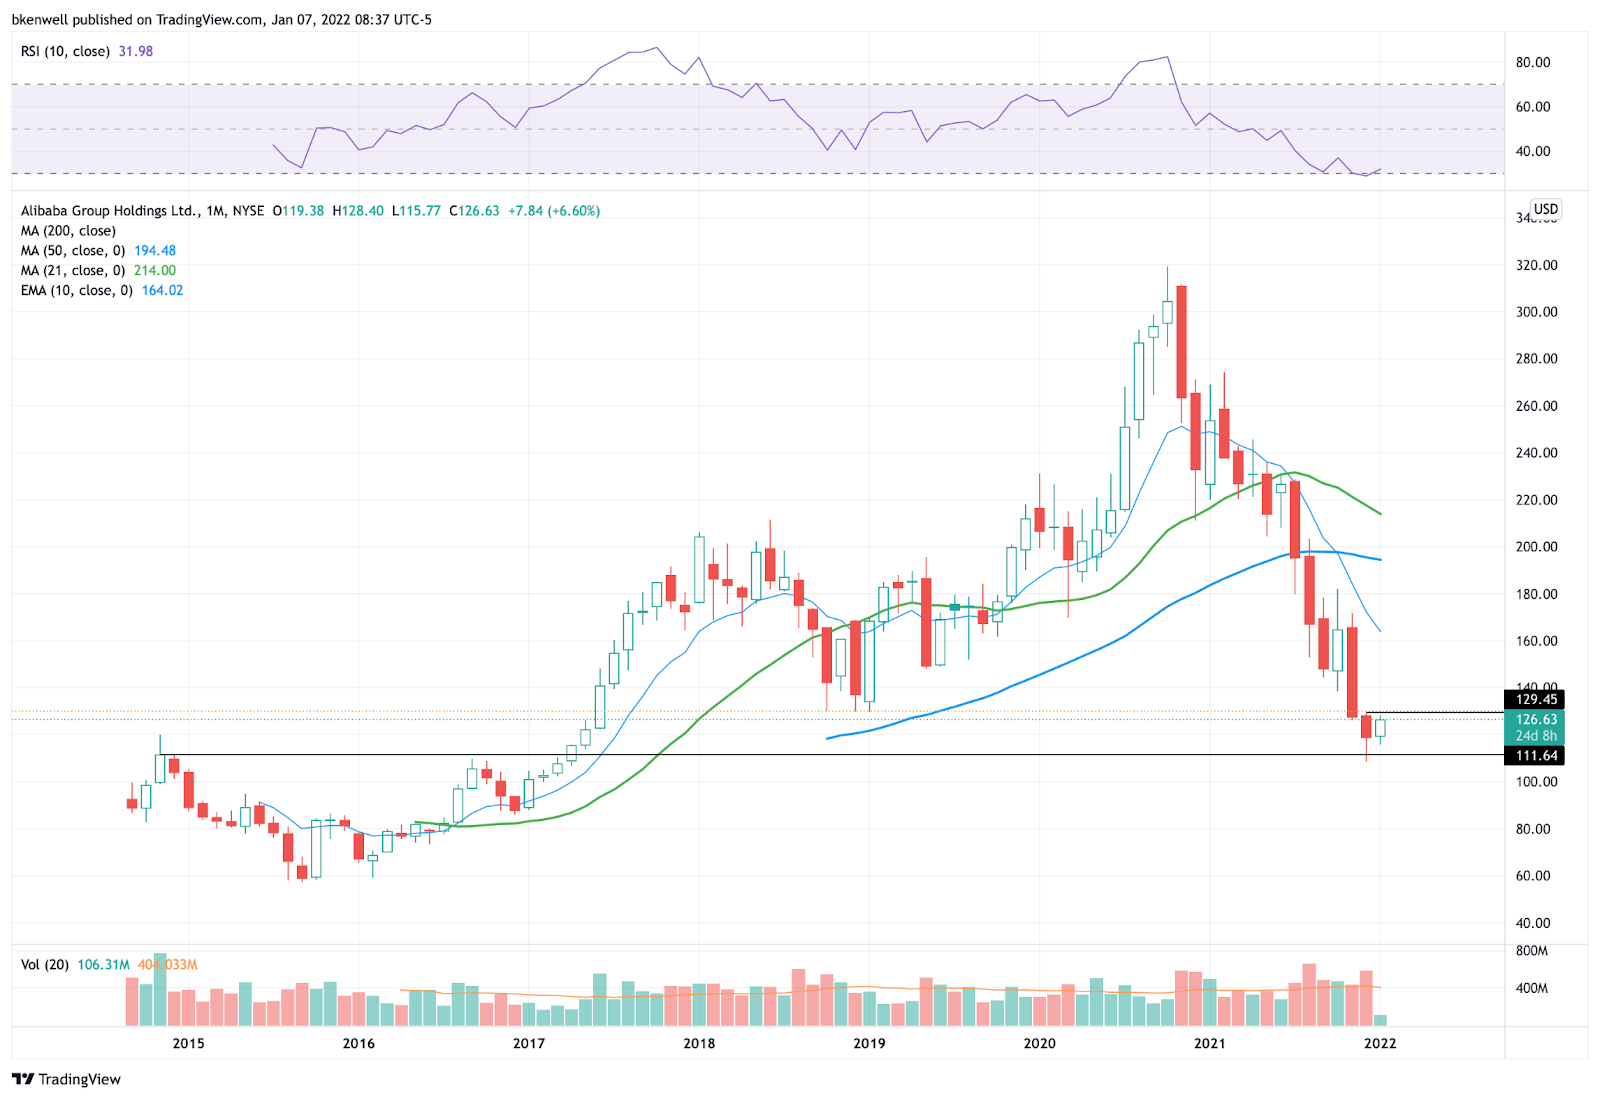
I know China-listed stocks are not exactly a go-to right now. But BABA is trading better, Charlie Munger is buying and the stock is flirting with a monthly-up rotation.
I will likely use a daily close above last month’s high at $129.50 as my trigger. But if BABA can go monthly-up, it’s not crazy to be talking about $147.50 to $150 next, then potentially the declining 10-month moving average.
Disclaimer: Charts and analyses are for discussion and education purposes only. I am not a financial advisor, do not give financial advice, and am not recommending the buying or selling of any security.
Remember: Not all setups will trigger. Not all setups will be profitable. Not all setups should be taken. These are simply the setups that I have put together for years on my own and what I watch as part of my own “game plan” coming into each day. Good luck!
Economic Outlook
Wages up, but jobs miss. Does that take a little heat off the Fed? My gut says yes but we’ll see.

Comments are closed