Our View
The Ned Davis S&P cash study for the December Triple Witching shows the Friday before expiration to be up 22 / down 15 of the last 37 occasions. As Jeff Hirsch said yesterday, you are supposed to be long after December 15th into the end of the year.
As you can see by the stats though, the December options expiration tends to be up. Here is a link to the S&P and Nasdaq cash studies.
Today is historically good, but there are some weak days next week so we want to remain patient and stick to the buy-into-weakness program as we are down to 15 trading sessions left in the year.
I know, there are a lot of bears that are just as enthusiastic about the downside as I am about the upside, and I understand the markets should correct…but just not into the end of the year. I will say one thing: 2022 could be a tough year for the markets.
Our Lean
Our game plan was to add to longs late Thursday for a push back up today. If the ES gaps up, our lean would be to sell the open or the first rally above the gap and buy the pullbacks. If the ES cooperates, we should eventually see 4720.
The Opening Print Recap
The ES traded 4684.50 on yesterday’s open and rallied up to 4694 a few minutes later. After the rally, the ES sold off ~13 points down to 4681.50 going into 10:00, rallied up to a lower high at 4691.50 and dipped back down to the 4684 area.
From there we rallied to another lower high at 4690.50 and then dropped down to 4675 just after 10:30. After some chopping, the ES dropped down to the early low of the day at 4674 and from 10:45 to 11:20, it traded in a 5 to 6 point range.
Then we had a pop up to 4692 just after 11:30, an area that had been resistance all morning and would remain that way into the afternoon. It was mostly back-and-forth chop throughout the session, filled with lots of little rips and dips on the shorter time frames.
However, at 2:37 the ES broke below the VWAP and sold all the way down to 4666.50 at 3:25, before bouncing up to 4680.50 at 3:48. This area of former support through the session flipped to resistance.
The ES traded 4678 as the 3:50 cash imbalance showed $750 million to sell and traded 4666.75 on the 4:00 cash close. The S&P futures fell for six straight 30-minute windows into the close. After the cash close, the ES shed about 5 points, falling down to 4662.25 at 4:08, but bounced and settled at 4668.50 on the 5:00 futures close, down 29 points or 0.62% on the day.
In The End
In the end, it was an all-around slower day, which could be seen in both the overnight Globex and day session volumes. In terms of the ES’s overall tone, it traded weakly but that’s what we were expecting. In terms of the ES’s overall trade, 1.54 million futures were traded, down notably from a week ago.
As we all know, there’s no crystal ball when it comes to trading stocks, options, or futures. But the Market Imbalance Meter may be as close as it comes. Knowing how the “Big Money” is placing its bets can give our trading room a big wave to ride — or a warning sign to stay out of the water. Come check it out now, risk-free for 30 days.
Technical Breakdown
- NYSE Breadth: 77.7% downside volume
- NASDAQ Breadth: 70.2% downside volume
Yesterday was a chop fest, plain and simple. That should come as little surprise after we said this before the open:
“We do have some potentially choppy events to navigate, starting with today’s “Roll Day.” Next Friday is quad-witch expiration, as well. The latter can lead to choppy price action early in the week too.”
Some people thrive in choppy conditions (but then struggle in trending conditions). Other traders — like swing traders — thrive in trending conditions and really struggle during the choppy periods.
Know what environment you trade best in and work on singling out those types of conditions. It took me a long time to realize that!
Breadth was on the heavy side during yesterday’s decline, but after such a robust start to the week, the way we finish it is going to say a lot. I’d love to see the S&P 500 finish in a weekly-up setup. The Nasdaq could too, but an inside week wouldn’t be bad either, as it has yet to fire above last week’s high.
Let’s not force anything. Again, we’re in a period that can be a little tough to navigate with swing trades. Today’s CPI number could be a market mover and I think some of the late-day decline on Thursday can be attributed to this report, due up at 8:30 am ET.
S&P 500
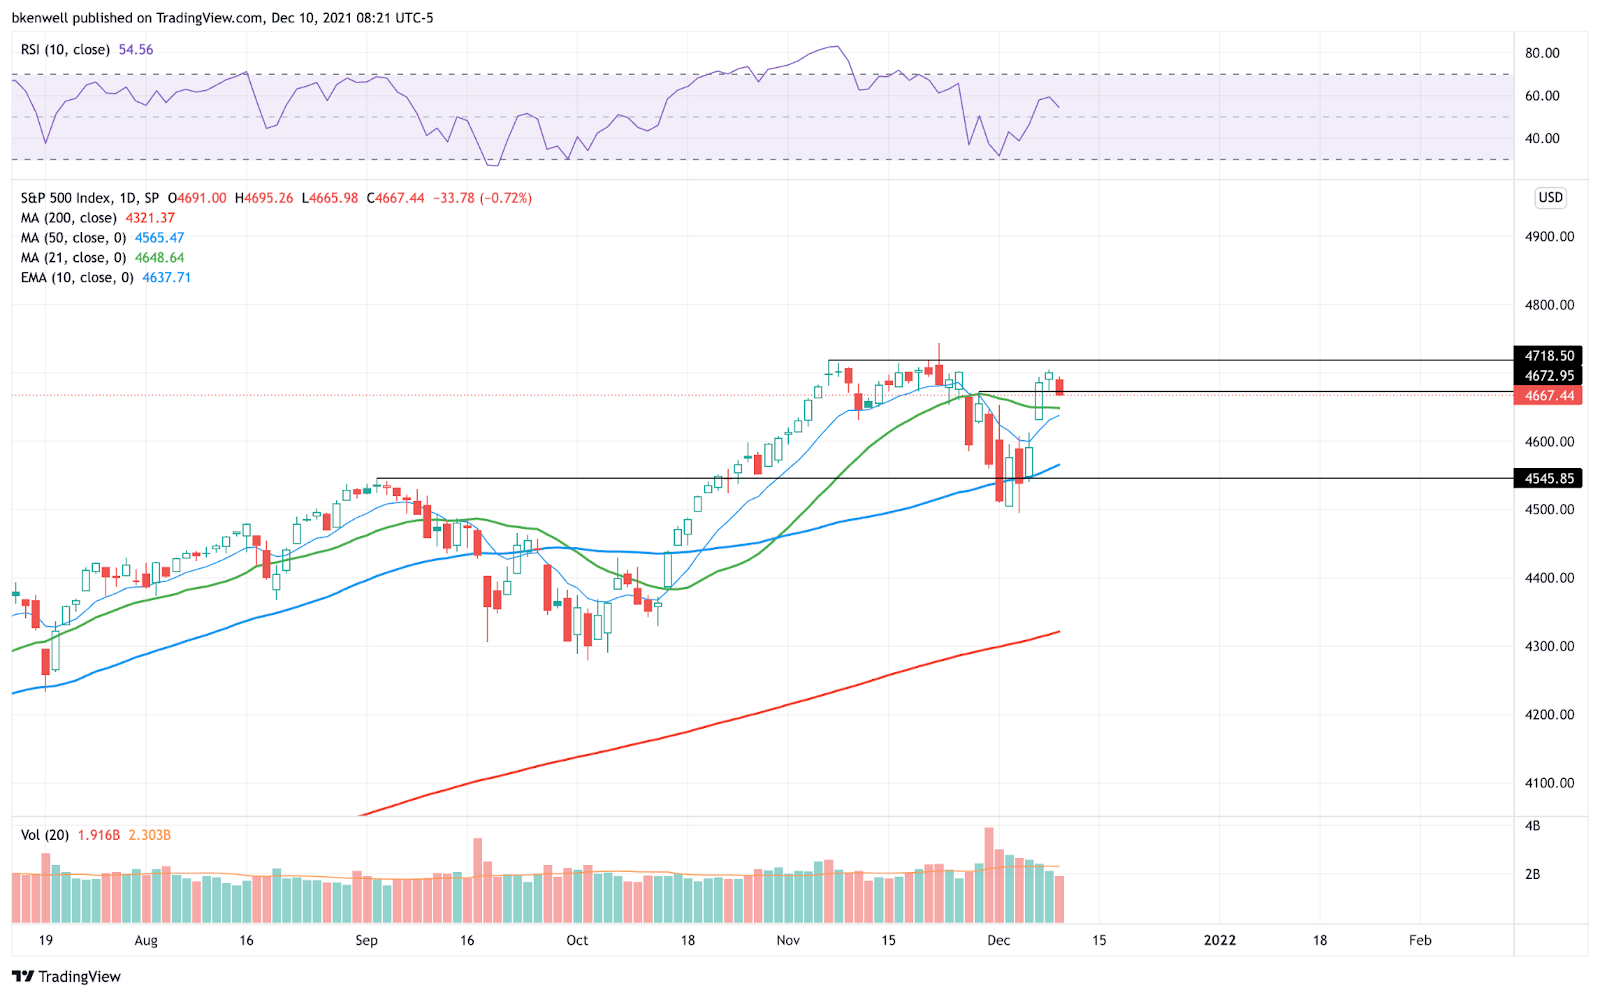
I would love to hold above last week’s high at ~4667.50 in the S&P 500 index. Above this week’s high and 4720+ is possible.
Below last week’s high and bulls need to defend the 10-day and 21-day moving averages.
Nasdaq

Let’s zoom out a bit with a weekly chart here. We’ve had multiple 7.5%+ dips this year down to the 21-week moving average. So far, all of those dips have led to new highs.
Unless the Nasdaq Composite takes out 15,833 on the upside or 14,931 on the downside, we will get an inside week going into the weekend. That sets us up for a potential inside-and-up or inside-and-down rotation.
Whichever it is, take it in stride and trade what the market is giving us. A rotation lower that’s not a false breakdown likely puts the 50-week moving average in play. A rotation higher that’s not a false breakout likely puts 16,150+ in play.
For this decline, we had a peak-to-trough fall of 7.9%. That’s pretty normal based on this year.
Individual Stocks — A Learning Lesson
We got the inside day we were looking for Nvidia, but no trigger on the rotation higher. That’s just fine, as Qualcomm gave us a pretty potent 2.25% rally from the daily-up trigger we were watching.
However, the stock closed lower on the day, down 0.2%. Have a look at what I tweeted yesterday in regards to QCOM.
Last week’s high was at $186.81. The stock topped about $1 a share above that mark. From there, I raised my stop up to break-even on the trade (as I do with almost all of my trades once I start trimming).
It’s a more conservative method, but I’d rather take ⅓ or ¼ of my position off for a profit and exit the rest at even than take a loss on a bulk of the trade. That’s just the way it goes sometimes.
Who’s to say QCOM wouldn’t have blown through $189 and made new all-time highs?
Homebuilders
The relative strength remains in this group. HD, LOW, BLDR (especially), TOL, LEN, TREX — etc.
A lot of these stocks were higher yesterday. Many remain at or near the highs and are in strong uptrends. Don’t lose focus of the leaders. Semiconductors continue to perform well too.
Apple

Apple has been a monstrous performer as of late. However, yesterday it pushed above the prior high and failed to hold.
That’s not an outright “sell and get short sign,” but when combined with a little bearish divergence on the chart, it’s just something we want to take notice of.
If Apple (and its near $3T market cap) struggles, then the QQQ may have some trouble too.
A move below yesterday’s low at $173.94 could take a little steam out of this, but that may be healthiest for a buy-the-dip setup going into the second half of the month.
Again — not necessarily bearish on Apple here, just looking for a reset.
Broadcom

Yesterday I did a little mapping of AVGO ahead of earnings. Essentially, where to buy the dip and where the rally could go.
Shares are changing hands at $625 in the pre-market now, just under the 261.8% extension. Let’s see if it can gain traction over this level or if it fades from here.
Disclaimer: Charts and analyses are for discussion and education purposes only. I am not a financial advisor, do not give financial advice, and am not recommending the buying or selling of any security.
Remember: Not all setups will trigger. Not all setups will be profitable. Not all setups should be taken. These are simply the setups that I have put together for years on my own and what I watch as part of my own “game plan” coming into each day. Good luck!
Economic Outlook

Comments are closed