- Yesterday, we published a short video regarding the S&P 500. Give it a watch when you have a couple of minutes!
- For those of you who use Twitter, please consider joining our new Community: The Opening Print.
- We want to use this group just for a few updates a day/week, with price targets, stop-loss adjustments, etc. It seems like the most feasible way to deliver updates rather than via email.
- Have a great weekend!
Our View
Not even the PitBull argues with me when I say there has never been a period like this. Not 1987, not 2000, not 2008, not 2010, and not the outbreak of Covid-19 in 2020.
There are no more ticks in the ES, either. Remember when the ES was 0.25 bid for 250 lots and 100 lots offered at 0.50? It wasn’t long after Covid broke out that several new, bigger, and more powerful BOTs were roaming the index. These BOTs were not designed to buy it at 0.25 and sell it at 0.50. These bots are called MEGA and they are much more disruptive and front-run any order of 20 lots or more.
A friend of mine who works for a trading firm that runs over 25 systems said, “the BOTs were designed to take on large size orders — it’s all speed.” When the BOT recognizes certain patterns of buying and selling, it forces the customers to “pay up.” On the days when the range expands beyond 100 points, these systems can make over 5 times the other algos.
I don’t know all the ins and outs of the algo world, but what I do know is 0.25 bid at 0.50 offer is now 3899 bid at 3905 offer with ‘no size’ — meaning the 250 lots and 100 lots are gone and it’s now 2 lots and 14 lots.
At my S&P desk, we used to take orders from hedge funds that would do anything from 2,500 lots to 5,000 lots all the way up to 10,000 lots. Back then it would take 4 to 6 points to fill 5,000 and up to 7 or 9 points to do 10,000 — provided someone was not front running you.
And remember, 7 to 9 points was a lot larger of a range back then vs. today, with the ES trading near 4000 now and sub-1000 in the 90s. If you needed to sell 10,000 ES in a “get’em done!” order, I could see the ES falling 20 to 30 points and possibly more.
Bringing it back to the here and now: It’s a rough game and it’s ok to make some money, get up from the office chair and go do something else. If you miss a few trade opportunities, I assure you the same BOTs will be waiting for you when you come back.
Our Lean
According to the Ned Davis cash study for the S&P and Nasdaq, the stats for the May options expiration are a coin toss, up 19 of the last 38% occasions — 50%.
After looking at what happened to Walmart and Target this week, I think high inflation and slower growth raise the risk of a global downturn. this isn’t something that just gets better overnight, especially with the Fed hiking without fear.
While the ES closed lower and could not hold the rallies yesterday, it’s actually been in a big back-and-fill pattern between 3860 to 3890. I think the reason it’s held is because of all the short option positions that expire today. Meaning we should see higher prices.
If the ES gaps higher you have two choices: Sell the early rallies and buy the pullbacks or just be patient and buy the pullbacks. Again this is not a bullish endorsement. Next week we very well could take out the lows and continue to fall.
Daily Recap
The ES opened Thursday’s regular session at 3887.50, rallied up to 4020.50 at 9:38, and dropped almost 50 points down to 3874.00 at 9:50. That’s a 33-point rally and a 46-point drop in the first 20 minutes — and much of the day was like this. After a long Lean and View, it’s too much to recap every move. I mean, just look at yesterday’s 10-minute chart:

The ES traded 3905.50 as the 3:50 cash imbalance showed $1.25 billion to sell, then sold back off down to 3893.25 and bounced up to 3904.75 and traded 3894.75 on the 4:00 cash close. It settled at 3898.25 on the 5:00 futures close, down 24.5 points or -0.62% on the day.
In the end, it was an unbelievable day of 20 and 40 point chops, then dropping 20 to 40 points. In terms of the ES’s overall tone, it looked like it was trying to firm up late, but the weak NQ and MIM sale weighed on the close. In terms of the ES’s overall trade, volume was decent at 2.27 million contracts traded.
- Daily Range: 87.5 points
- H: 3943.50
- L: 3856
Technical Edge
- NYSE Breadth: 59% Upside Volume
- NASDAQ Breadth: 61% Upside Volume
- VIX: ~$28.50
Following a 90% downside day, the market just couldn’t gain any traction…for either side!
At one moment you look at the screen and ARKK is up 6% while AAPL is down 2% and the Nasdaq is mixed. Then it looks like it wants to rally but loses steam. So it starts to break down, but then in come the bids.
It was a back-and-forth slopfest, but the chop was tradeable if that’s part of your style. I had an appointment and missed the second half of the day and after looking at the final 4 hours, I’m glad that was the case.
Game Plan — S&P (ES and SPY), Nasdaq (NQ and QQQ), Individual Stocks
The ES is currently down ~2% for the week as it bounces during Globex, while the index is down 3%.
We have gone over the statistics already, but only once in the last 30 years have we seen the S&P fall for seven straight weeks. The index is also off 18.2% so far this year, its worst start since 1940.
The silver lining for bulls is that in situations like this where the losses eclipse 15%, the S&P has rallied nicely into year-end (and 3 out of the 4 occasions, by double-digits). Of course, that doesn’t mean it will happen this time, but it’s something to think about.
S&P 500 — ES

It’s not simple, but the ES levels are fairly straightforward.
On the upside, the ES needs to clear Thursday’s high of 3943.50. That opens the door to the 3975 level, the 50% retrace of this week’s range. Above 3975 puts 3990 to 4000 on the table.
On the downside, use caution below 3905, Wednesday’s 90% downside-day low. Below that and the 3855 area is in play, where we find this week’s and last week’s low.
SPY
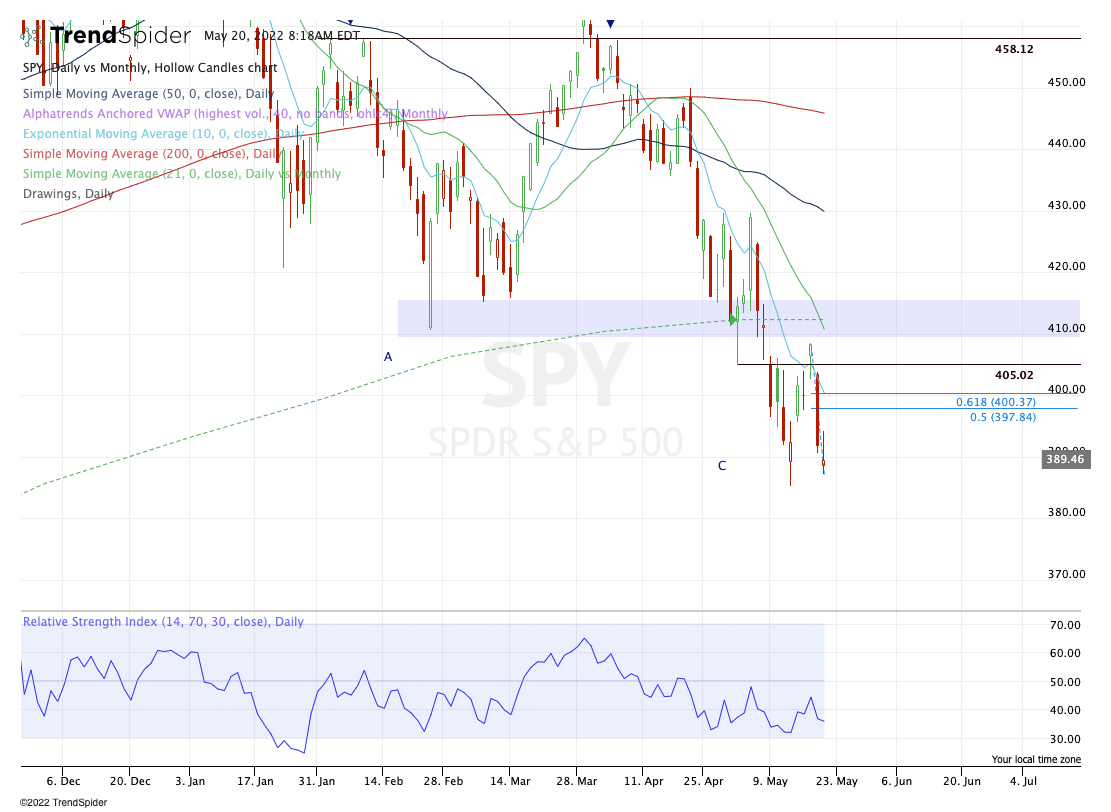
On the upside, watch yesterday’s high at $394.14. Above that opens the door up to the $397 level, potentially followed by a push toward $400.
On the downside, below $390.55 is a cause for caution. Below Thursday’s low at $387.11 opens the door down to the low at $385.
Nasdaq — NQ

With the NQ, I have the two-week high and two-week low highlighted on the chart with black lines.
A break of either one of those levels and failure to trade back within the range could create a continuation trade in the respective direction. On the downside, that could set the stage for 10,700 to 11,000 and on the upside and on the upside, it could put 13,500 on the table.
In the short term, watch yesterday’s high at 12,077. Failure to hold above this level keeps 11,900 in play. However, if it can push above 12,077 and hold strong, bulls could put this up to the 12,225 to 12,250 zone.
Below 11,895 and traders need to be cautious of more downside.
Bonds — ZB
Same setup from yesterday as ZB is still trying for weekly-up over 141.03.
Oil — XLE

Yesterday we had a quick Red-to-Green trade in XLE and let us trim into strength. Let’s see if we can’t get $84+ to trim more or all of this now.
Stop-loss just below yesterday’s LOD or at break-even — whatever fits your tolerance.
Go-To Watchlist
*Feel free to build your own trades off these relative strength leaders*
Numbered are the ones I’m watching most closely. Bold are the trades with recent updates.
- AR — Target No. 2 at $36 was hit. → Ideal final target is $38.50 to $39. However, if we lose Wednesday’s low of $34, manage according to your risk tolerance (B/E stop is down near $31, but that’s a lot of profit to cough up).
- ABBV — Weekly up → Conservative trim hit. Stopped Out
- XOM — this target hit “Above $92+ and feel free to trim as much as you want.”→ B/E stop on the remainder of the position ($89). $96 to $97 is a big extension area if it can really get going.
Relative strength leaders (List is cleaned up and shorter!) →
- XLE — A nice run here. Let’s start looking at pullbacks to buy.
- AR
- PEP
- KO
- MCK
- MRK
- BMY
- JNJ
- DOW
Economic Calendar

As we all know, there’s no crystal ball when it comes to trading stocks, options, or futures. But the Market Imbalance Meter may be as close as it comes. Knowing how the “Big Money” is placing its bets can give our trading room a big wave to ride — or a warning sign to stay out of the water. Come check it out now, risk-free for 30 days.
Comments are closed