9-Week Win Streak to Start 2024
Stats show it hasn’t happened often
Follow @MrTopStep on Twitter and please share if you find our work valuable!
Our View
I made several predictions last year and only a few got close. One was that Bitcoin would trade $35,000 and the other was that the ES would drop 20% and then rally 20% — although it rallied more than that.
When I look back on 2023, there were a few key events that I can’t forget.
First, we had all the Fed rate hikes from 2022 continue into 2023. Second was the regional banking crisis. Third was all the geopolitical turmoil — again, a continuation from 2022.
I could list a few more, but I don’t want to copy something when I can post JP Morgan’s year-end reflections. I get a lot of bank reports, most of which I never read. but this report is one I always look for.
As for JP Morgan’s 2024 outlook, you can find it here.
In the end, it was a hell of a year for the stock market… let’s hope it keeps going in 2024.
Our Lean
I started talking about the MrTopStep end-of-year rebalance ‘walk away’ trade on Wednesday. I should have emphasized this more in Friday’s lean. That said, this is another pattern that you should keep in your trading toolbox. It works best at the end of the quarters and end of the year.
According to the Stock Trader’s Almanac, the first trading day of 2024 (Tuesday) has the Nasdaq up 18 of the last 26 occasions and the second trading day of the new year (and the last day of the Santa Claus rally) has the Dow up 21 of the last 30. There are two days left in the Santa Claus rally period, and so far, the S&P 500 is up about 1.5%. Let’s see how it finishes.
A note from HandelStats: We are indeed in rare territory. Since 1970, (2817 weeks). 1582 up weeks, 1234 down weeks, 1 unchanged week in the SPX. So I gathered all of the stats on consecutive up and down weeks. Currently we have just completed the 9 consecutive Up week. That has only happened 2 other times. There has only been one other time where the consecutive up weeks were greater: 12 week up period in 1985, 9/30/1985 – 12/16/1985. The market moved from 181.30 to 210.94 a 16.35% gain. The SPX is currently up from 4117.37 to 4769.83, a 15.85% gain.
The US Navy destroyed boats controlled by Iran-backed Houthi rebels while Hezbollah attacked an Israeli Army post, China is constantly warning the Philippines, and Putin fired off the largest volley of rockets and drones since the war began. The war in the Middle East is expanding. How will that play out?
Higher gold prices and a concerned stock market have defied some of the largest overbought readings in several years.
Our Lean is to keep an eye on the NQ. That was where the weakness came from last week and if it’s the same price action, we could see some more failed rallies. The other side of this is there could be new money put to work in the first few trading days of 2024. If that’s the case, then it could be a thin-to-win move back up toward the highs. Remember, the stats are good for the first two days of January.
For those of you who like HandelStats levels, here they are:
-
Upside: Trade and hourly close above 4779 targets -1sd at 4787.88 hourly close above there targets 4794.62, then 4799.88**. An hourly close above 4799.88** targets settlement at 4813.50. Hourly close above 4813.50 targets 4820.75*, hourly close above there targets 4824, then 4825.50, hourly close above there targets 4830.25, then 4835.25, 4837, 4838.75 and then 1sd at 4839.12.
-
**(4799.88 is a critical level needs daily close above to regain upward move)
-
-
Downside: Hourly close below 4779 targets 4777.62, then 4774.25. Hourly close below there targets 4765, then 4763.25, then -2sd at 4762.25. Hourly close below 4762.25 targets -1sd weekly at 4756.20, hourly close below 4755.51 targets 4742.25, then -3sd at 4736.63. Hourly close below there targets 4726.88, hourly close below there targets 4701.75, then -2sd weekly at 4698.91.
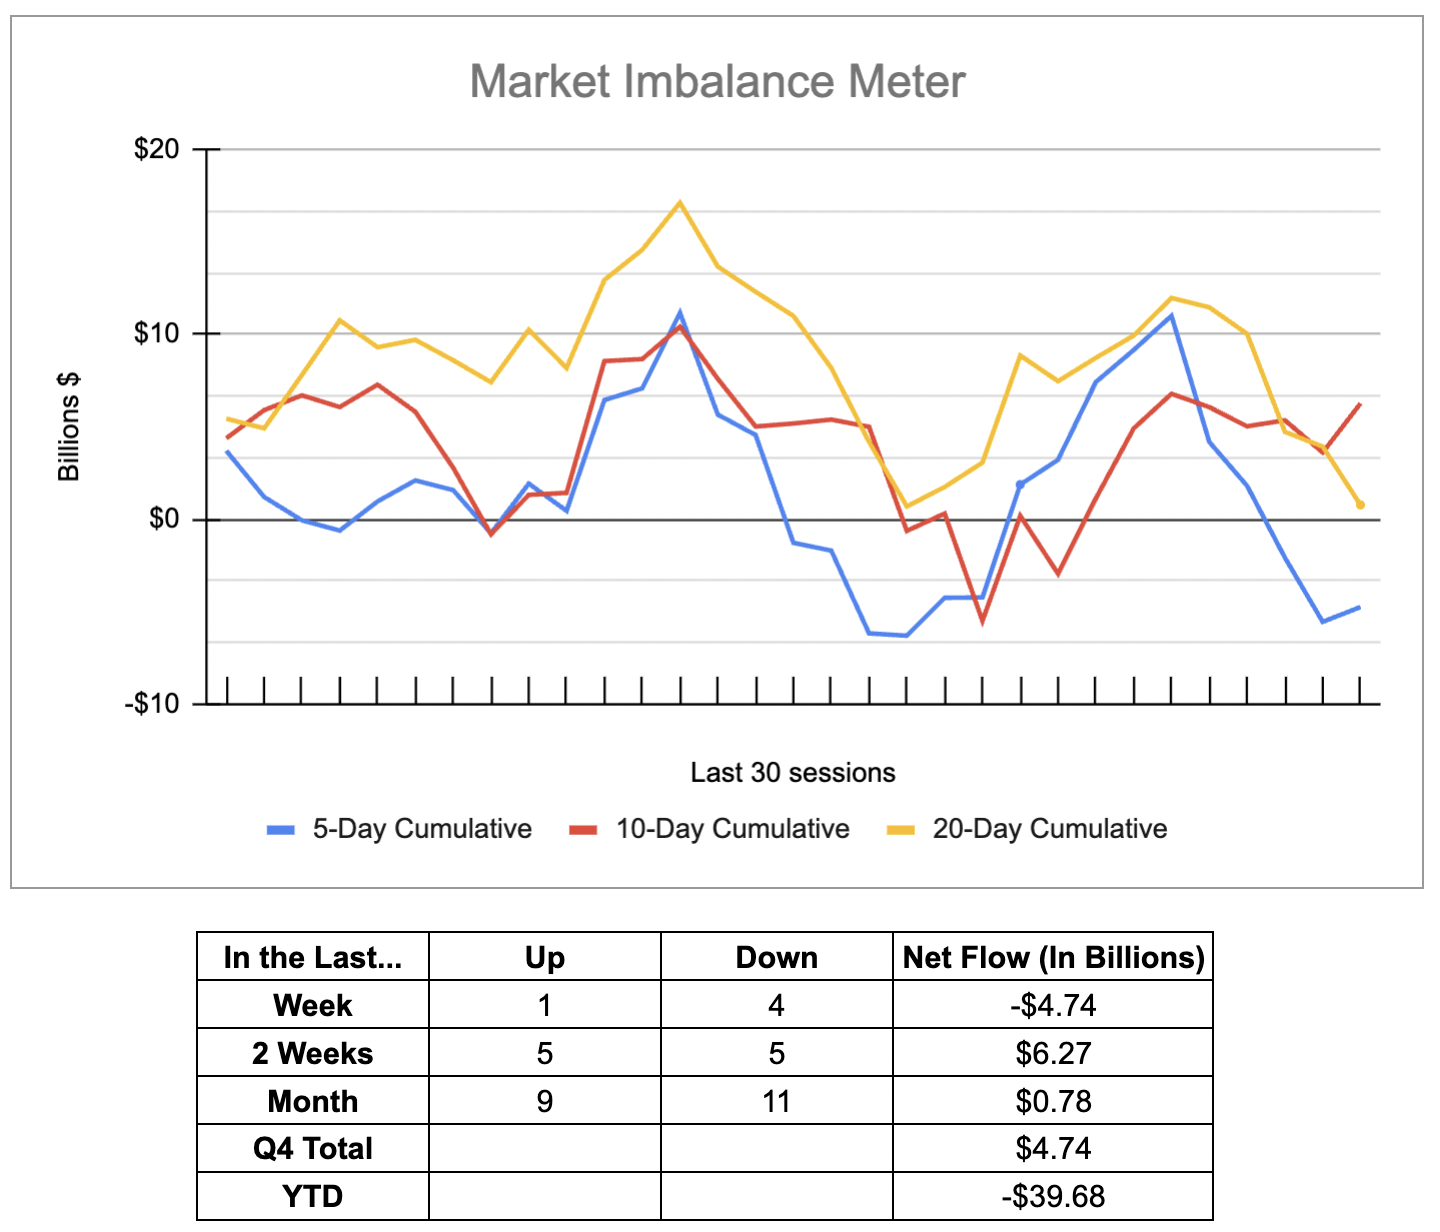
MiM and Daily Recap
ES 15-min recap
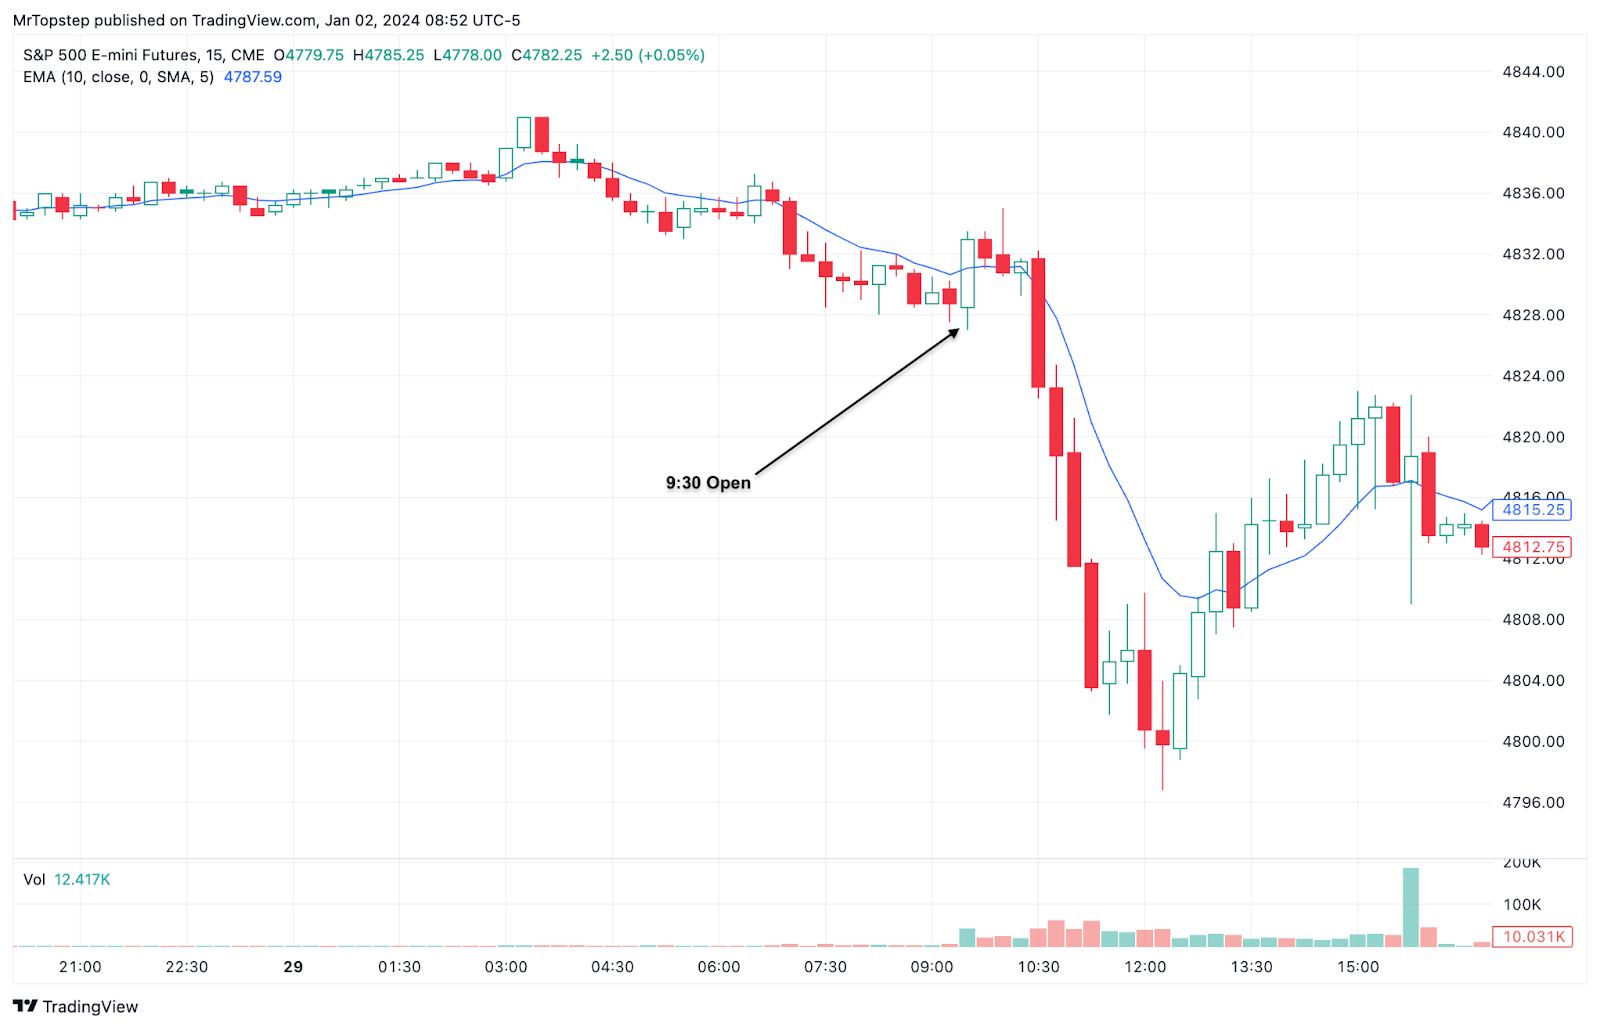
The ES traded up to 4841.00 and opened Friday’s regular session at 4828.50. After the open, the ES traded up to 4835.00 at 10:09 and then dropped 38.25 points down to 4796.75 at 12:24. Why? Because there was a ‘walk away’ trade, (which you can read about in the MrTopStep Trading Rules 101).
This trade had a solid success rate when I was on the floor, but kind of faded over the years. Still though, we have kept it in our trading toolbox. After the low, ES rallied back up to 4815.00 at 1:14 and well before the rally, I put this out IMPRO: Dboy : (1:03:58 PM) : I think 4815-18 could be a sell.
The ES traded up to the VWAP at 4818.50 at 2:28, pulled back 4 or 5 points, and traded up to 4823.00 at 3:11, and then started down-ticking as the NQ went offered and traded down to 4815.25 at 3:22. It traded back up to 4822.75 and sold off down to 4815.50 as the early imbalance showed over $2 billion to buy. The ES traded 4817.00 as the final 3:50 cash showed $3 billion to buy and dropped down to 4809.00. The ES traded back up to 4822.75 and traded at 4818.00 on the 4:00 cash close.
In the end, the last trading day of 2023 saw a pick-up in trade as the big institutional accounts stepped up the pace of the end-of-the-year rebalance. In terms of the ES, the weakness in the Nasdaq was the main drag on the S&P. In terms of the ES’s overall trade, volume was steady: 120k traded on Globex and 1 million traded on the day session for a total of 1.12 million contracts traded.
Some color on the walk-away trade (from Friday’s chatroom):
-
IMPRO : Dboy : (Fri:9:32:24 AM}) : watch out for the walk-away trade
-
IMPRO : PTGDavid : (Fri:9:35:11 AM}) : yes
-
IMPRO : manny : (Fri:9:35:46 AM}) : What is the walk away trade?
-
IMPRO : Dboy : (Fri:9:36:01 AM}) : nq sellers
-
IMPRO : Dboy : (Fri:10:32:44 AM}) : well there is a trade that had great success on the floor, at the end of the quarter / year that we used to do on the floor
-
IMPRO : Dboy : (Fri:10:33:44 AM}) : by 10:30 -11:00 CT all the buying gets used up and you get the walk-away traded (sell off)
-
IMPRO : Dboy : (Fri:10:34:32 AM}) : sometimes it works and it ends up the highs of the day and others they start to bounce going into 1:00
Technical Edge
-
NYSE Breadth: 28% Upside Volume
-
Nasdaq Breadth: 41% Upside Volume
-
Advance/Decline: 28% Advance
-
VIX: ~12.50
ES
Levels from HandelStats.com
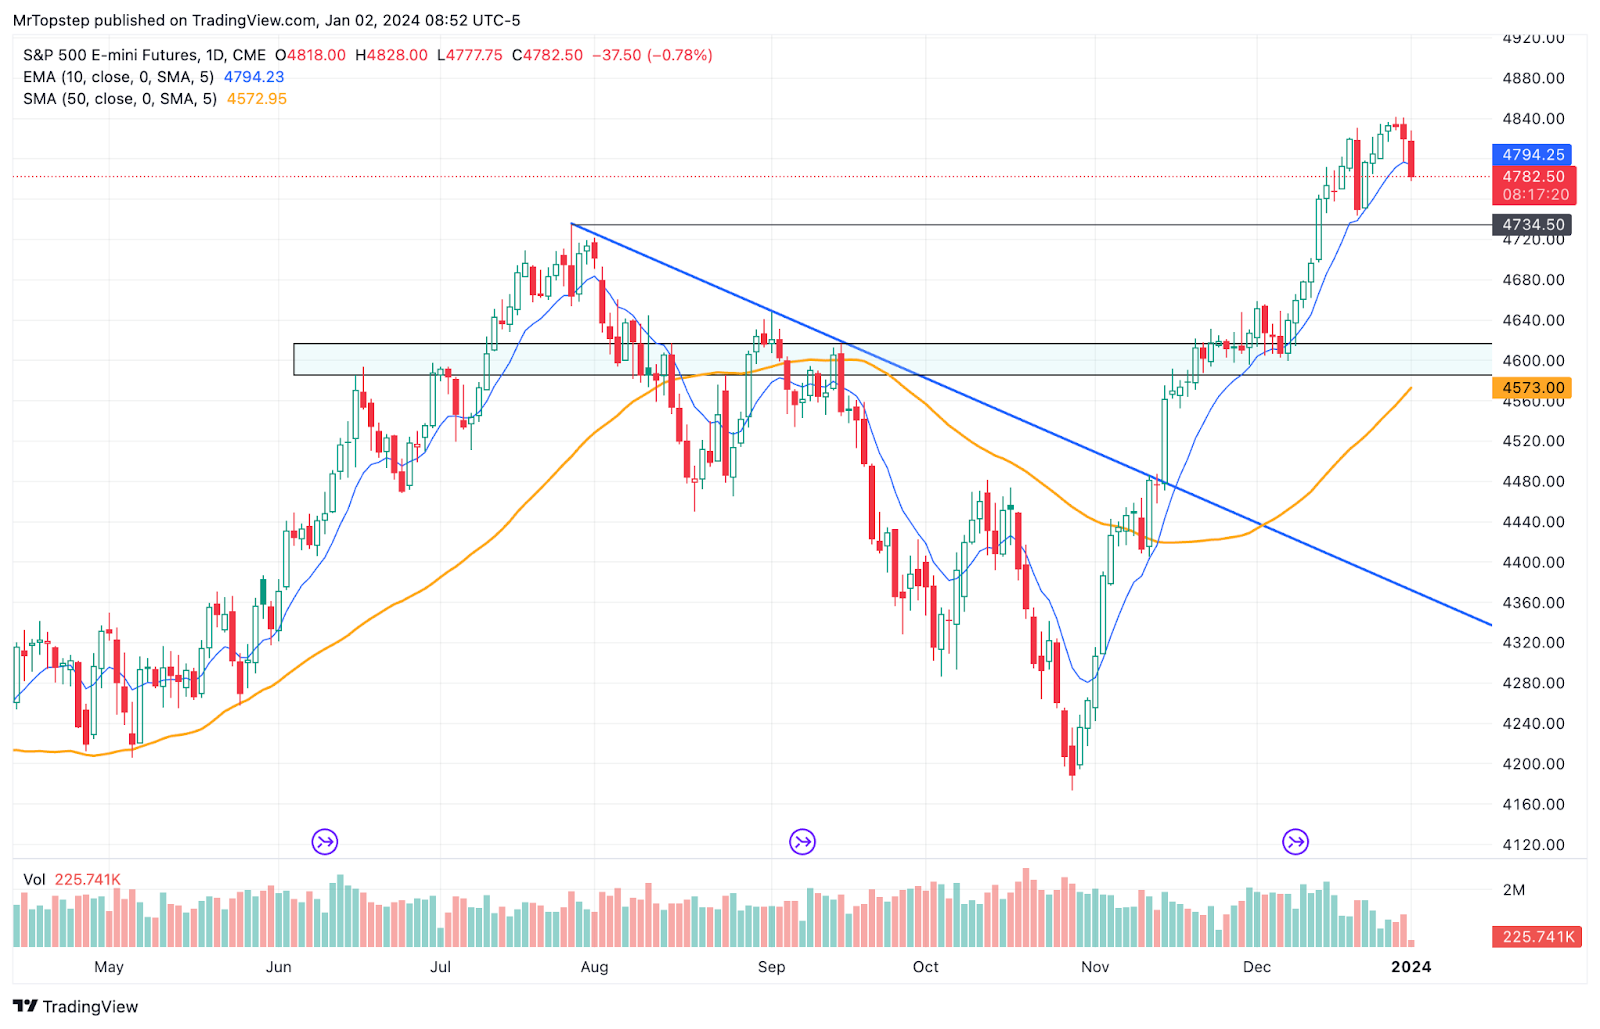
ES Daily
-
Upside: Trade and hourly close above 4779 targets -1sd at 4787.88 hourly close above there targets 4794.62, then 4799.88**. An hourly close above 4799.88** targets settlement at 4813.50. Hourly close above 4813.50 targets 4820.75*, hourly close above there targets 4824, then 4825.50, hourly close above there targets 4830.25, then 4835.25, 4837, 4838.75 and then 1sd at 4839.12.
-
**(4799.88 is a critical level needs daily close above to regain upward move)
-
-
Downside: Hourly close below 4779 targets 4777.62, then 4774.25. Hourly close below there targets 4765, then 4763.25, then -2sd at 4762.25. Hourly close below 4762.25 targets -1sd weekly at 4756.20, hourly close below 4755.51 targets 4742.25, then -3sd at 4736.63. Hourly close below there targets 4726.88, hourly close below there targets 4701.75, then -2sd weekly at 4698.91.
NQ
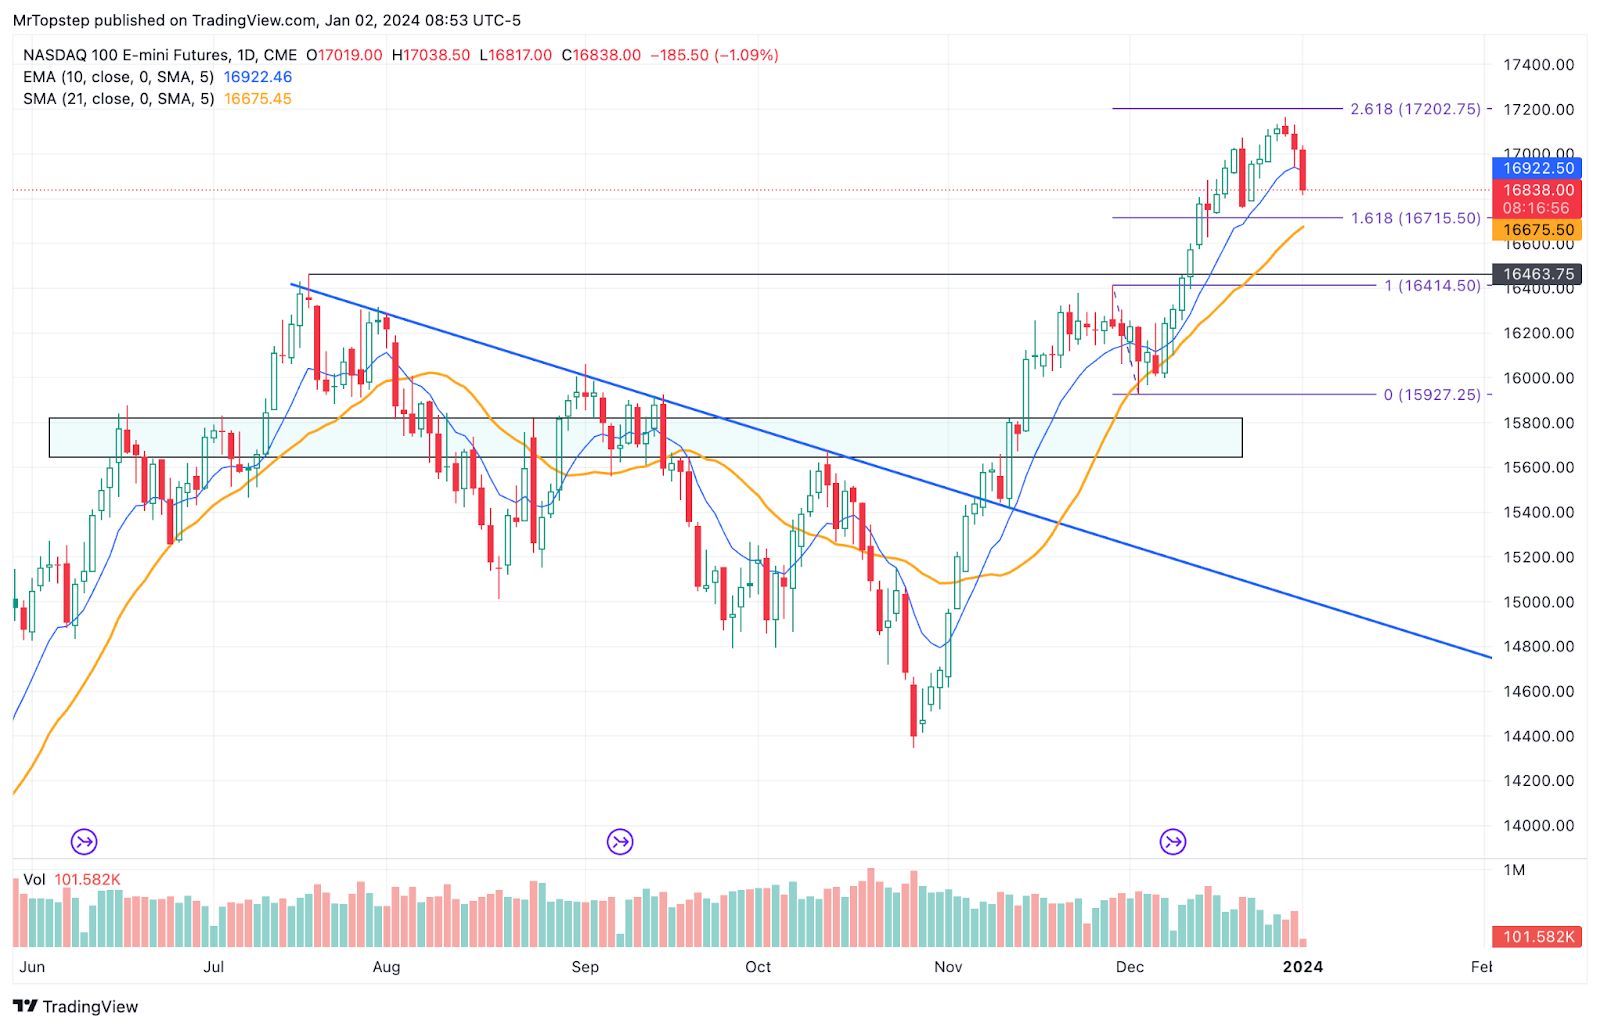
NQ Daily
-
Upside: Trade and hourly close above 16823.50 targets -1sd at 16865.69, then 16875.50, hourly close above there targets 16915.75**. Hourly close above there targets 16937.75 hourly close above there targets 17008 and settlement at 17009.75. Above 17015.25 targets 17030.50 then 17052.12. Hourly close above there targets 17084.75, then 17093, hourly close above there targets 17117.12, hourly close above there targets 17153.75, 1sd at 17153.81.
-
(16915.75 is a critical level needs daily close above to regain upward move).
-
-
Downside: Trade and hourly close below 16823.50 targets 16803.25, hourly close below there targets 16740.50, then -2sd at 16721.64. Trade and hourly close below there targets 16682, hourly close below there targets -1sd weekly at 16634.70, then 16608.35, then -3sd at 16577.58. Hourly close below there targets 16537.62, hourly close below there targets 16492.
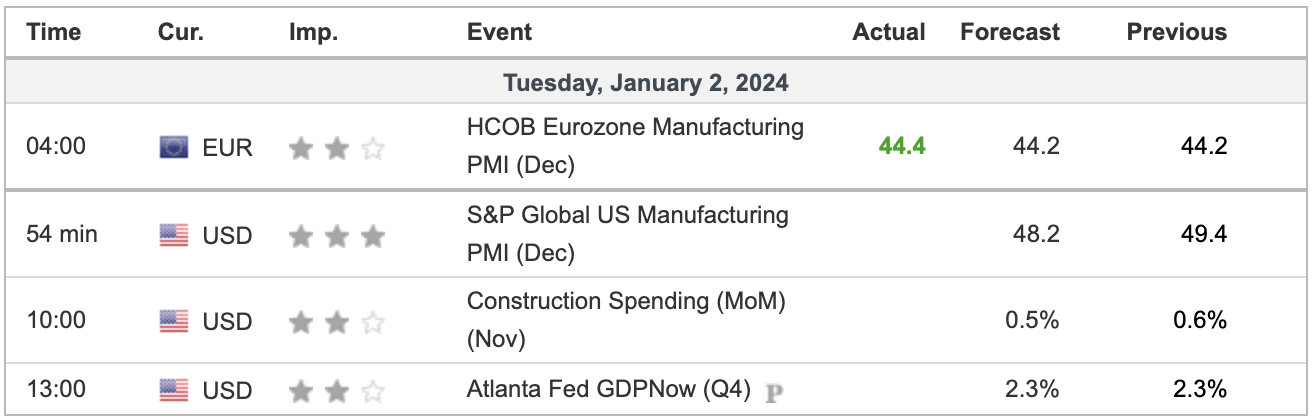
Economic Calendar
Comments are closed