Back to Buying the Dips?
CPI, Earnings Headline This Week’s Events
Follow @MrTopStep on Twitter and please share if you find our work valuable!
Our View
The emphasis at the end of last year and the beginning of the new year is a three-letter word — The “Fed: — and expectations for lowering rate 6 times in 2024.
The S&P closed out the last few trading sessions of 2023 on the weak side, which carried through on the downside last week with a 1.6% loss in the first 4 sessions of the year after the Fed said they didn’t have a timetable for when they will start lowering interest rates.
Had it not been for the late-day Friday buy program, the ES would have been down 4 of the first 4 sessions of the year — not exactly what the bulls had in mind. Bonds fell and inflation again became the focus as the large institutional accounts sold billions in tech holdings in 6 out of the last seven sessions.
While the PitBull did mention that he had seen the first session of the year down, I also remember times when the ES closed out the year on the highs after a big rally and then fell apart. Are we in for more downside? When you look at the ES being down almost 20% and closing up 24%, the 1.6% decline in the S&P is minuscule as is the Nasdaq’s 3.5% fall.
So far everything has been orderly. Volumes have remained on the low side and the ranges have started to expand. At the ES 4702 low, the ES has sold off 140 points from its December contract high. Again, I think it’s sufficient for a small pullback, but there has been zero panic.
There is an abundance of new long and sidelined cash getting ready to be put to work on stocks. I always like reminding people there is a full year in front of us and there is no need to force trades. This means there are going to be a lot of big rips and dips in 2024.
Our Lean
I am going to put up my own levels. I know they are not as good as @HandleStats, but sometimes it’s a good idea to pull out a wider timeframe chart and start writing out the old highs and lows.
I do think the ES closed ok on Friday and we could see some more upside today. The old range was 4740-4770 and Friday’s range expanded it to 4700 to 4770. If the ES can get above 4770 and start running some stops, I think there is a possibility of expanding the range on the upside.
Our Lean is if the ES opens lower on Globex, buy it, if the ES opens lower on the day session, buy it — or just buy the pullbacks. I know this goes against the grain, but I think we could see a rip higher. The question is, will it hold?
For those of you who like HandelStats levels, here they are:
-
Upside: Upside: Trade above 4735.25 targets settlement at 4737. Trade and hourly close above there targets 4740.88, then 4750.50, then 4755.51, then 1 sd at 4765.61. Trade and hourly close above 4767 targets 4775.12, then 4783.25. Hourly close above there targets 2sd at 4794.23. Hourly close above there targets 4799.88** (daily close above 4799.88 turns the up trend back on).
-
Downside: Trade and hourly close below 4732.50 targets 4724.25, then 4716.50. Trade and hourly close below there targets -1sd at 4708.39. hourly close below there targets 4705.35, then 4701.75. Hourly close below there targets 4698.99, then 4691.62, then 4683.50, then 4679.75, then -2sd at 4679.77.
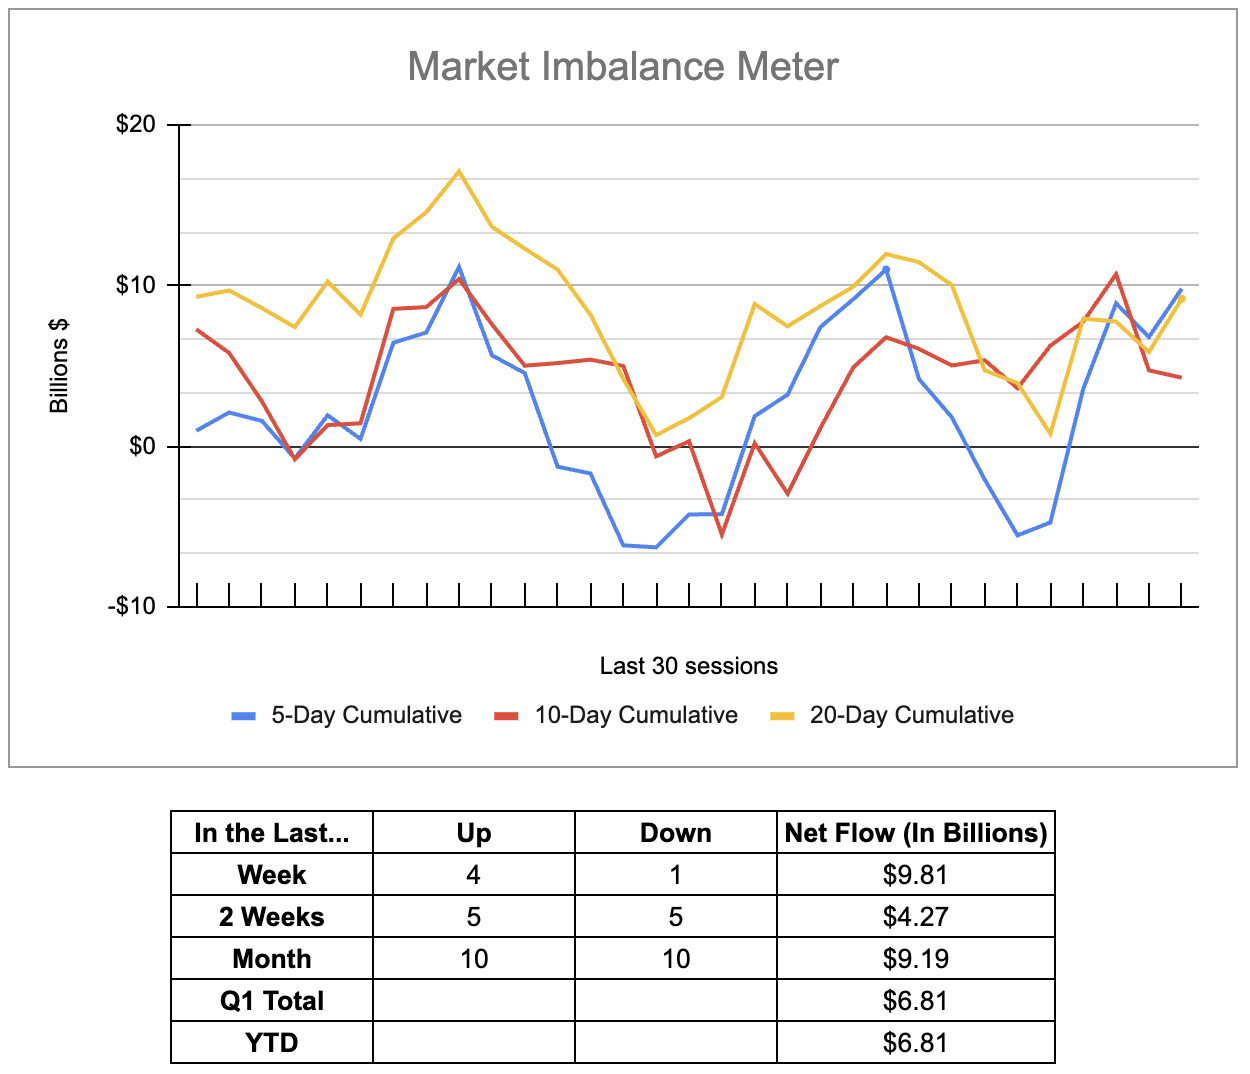
MiM and Daily Recap
Due to a slight hiccup, we are just including the MIM levels, breadth, charts and levels today.
Remember, this week will feature the CPI report on Thursday and the PPI report on Friday, which could impact rate-cutting bets for later this year. Also, Friday marks the start of earnings as US banks kickoff the Q1 earnings season.
Technical Edge
-
NYSE Breadth: 60% Upside Volume
-
Nasdaq Breadth: 37% Upside Volume
-
Advance/Decline: 54% Advance
-
VIX: ~13.75
ES
Levels from HandelStats.com
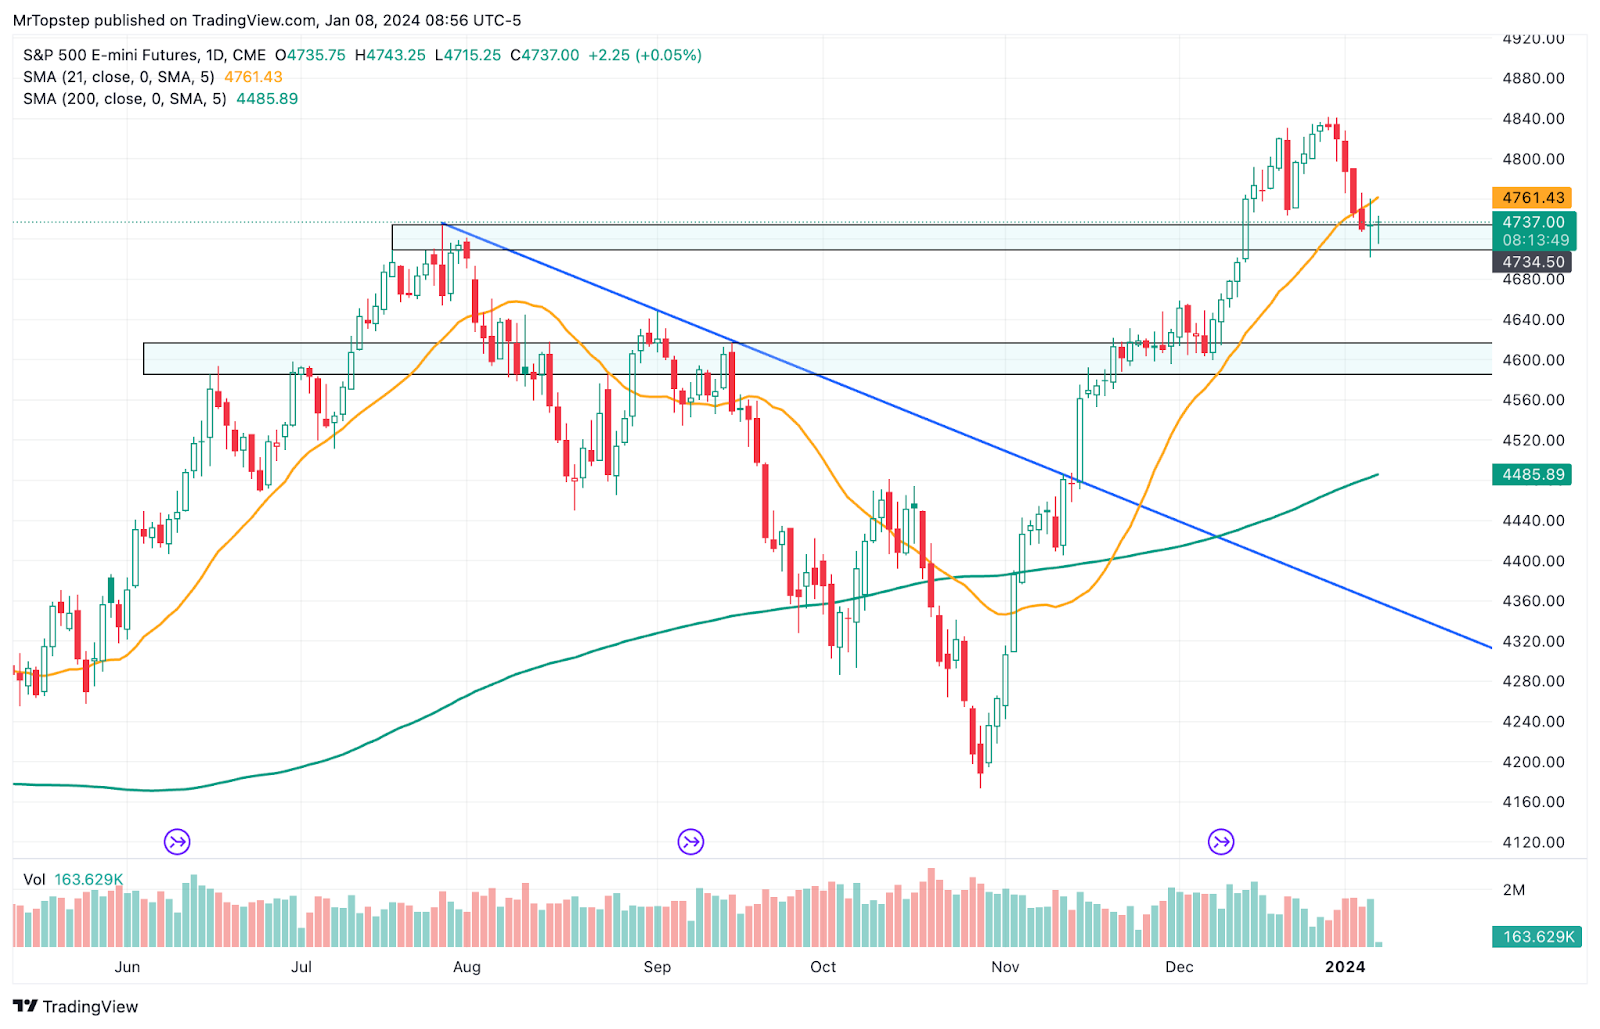
ES Daily
-
Upside: Trade above 4735.25 targets settlement at 4737. Trade and hourly close above there targets 4740.88, then 4750.50, then 4755.51, then 1 sd at 4765.61. Trade and hourly close above 4767 targets 4775.12, then 4783.25. Hourly close above there targets 2sd at 4794.23. Hourly close above there targets 4799.88** (daily close above 4799.88 turns the up trend back on).
-
Downside: Trade and hourly close below 4732.50 targets 4724.25, then 4716.50. Trade and hourly close below there targets -1sd at 4708.39. hourly close below there targets 4705.35, then 4701.75. Hourly close below there targets 4698.99, then 4691.62, then 4683.50, then 4679.75, then -2sd at 4679.77.
NQ
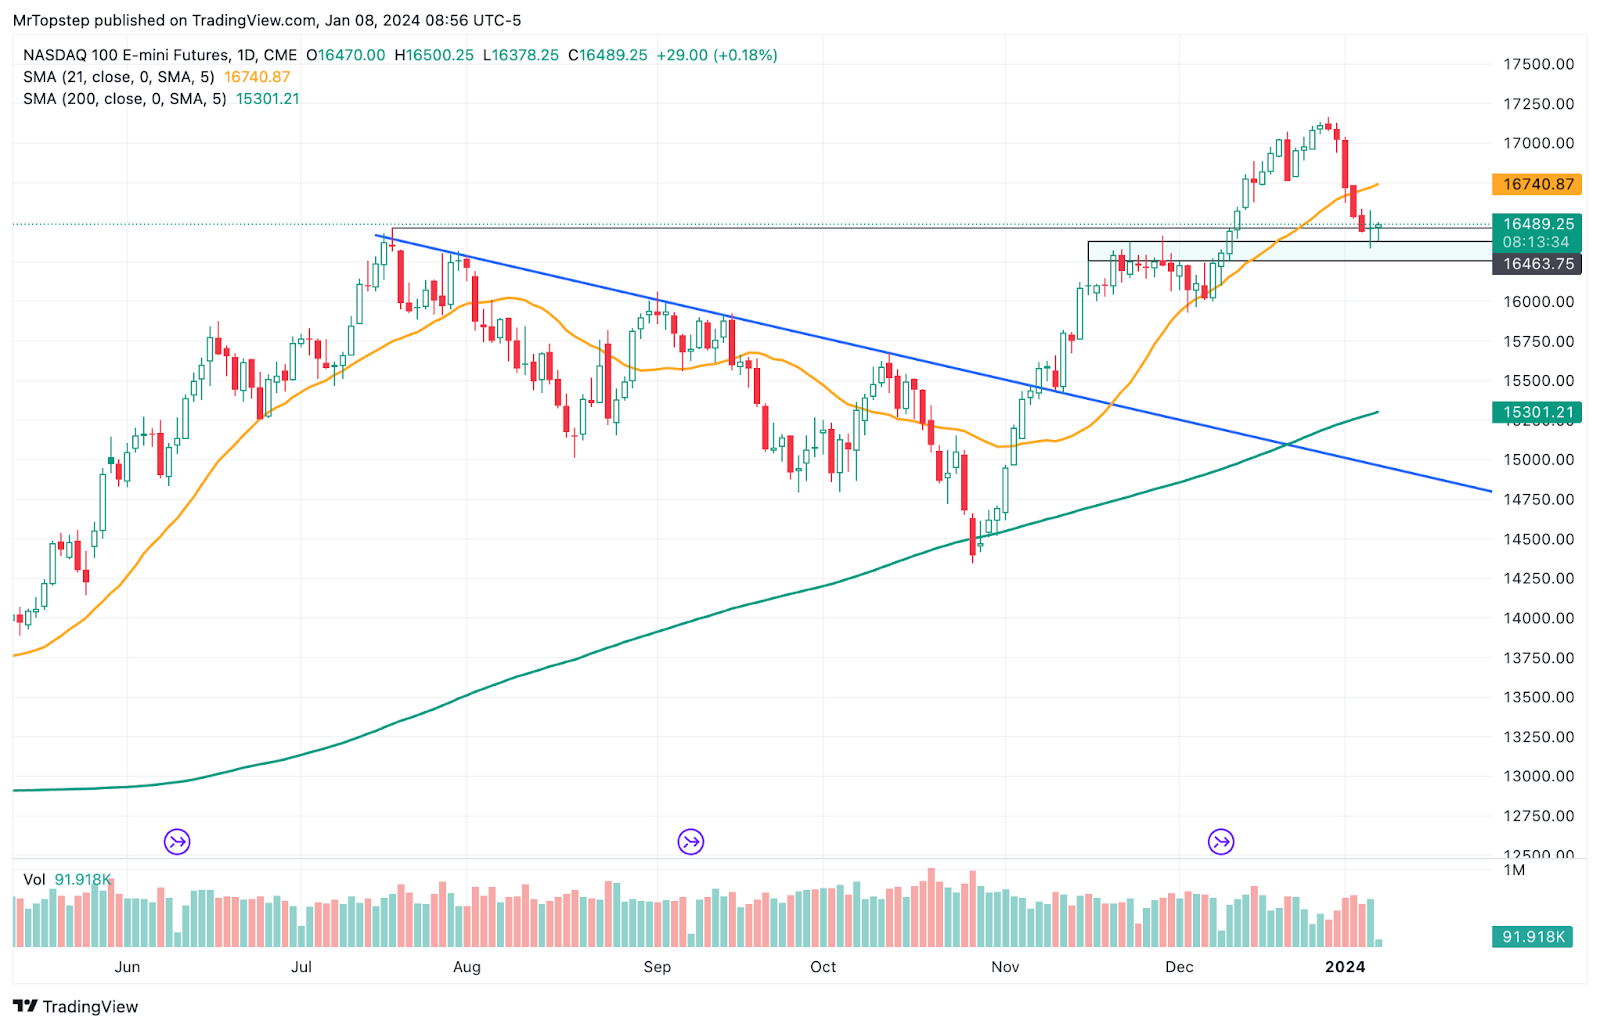
NQ Daily
-
Upside: Trade and hourly close above 16484.75 targets 16495.62, then 16519.25, then 16549, hourly close above there targets 16607, then 1sd at 16610.50. Hourly close above there targets 16621.75, then 16652.12, then 16695, hourly close above there targets 2sd at 16753.76
-
Downside: Trade and hourly below 16448.25 targets 16392.25, then 16366.12, hourly close below there targets -1sd at 16324. Hourly close below there targets 16289.75, then 16263. Hourly close below there targets 16197, then -2 sd at 16180.74.
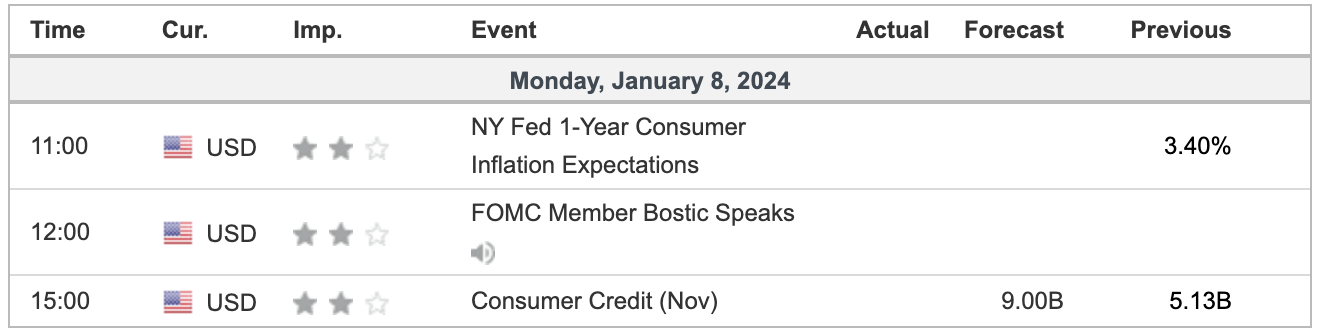
Economic Calendar
Comments are closed