Bonds/Bond Yields Present New Risk
But will it matter?
Follow @MrTopStep on Twitter and please share if you find our work valuable!
Every week, MrTopStep invites traders to an “Own the Close” contest where the closest guesstimate where the SPX will settle on Friday’s 4:00 cash close.
The winners get a free week’s access to the MrTopStep Chat and trading tools. Enter your guess now!
Our View
Aside from the extreme stock market complacency and geopolitical events hanging over the S&P, there is another very serious problem showing up that could be a major stumbling block for the US economy and it’s a five-letter word: BONDS!
Dapu — a trader in the MrTopStep chat room — said that last week’s bond auction got a D rating. This is something I think you need a lot of higher learning to understand…who will buy our government debt? Hotter-than-expected inflation reports alongside the Fed finally admitting that lower rates are not coming anytime soon isn’t helping matters.
We don’t need anyone to tell us that prices are stabilizing because we are on the front line. The average price at the pump for US drivers has risen nearly 6.5% in the past month, from $3.39 to $3.61 per gallon. vs. December when the average cost per gallon was $3.15.
Yes, seasonalities do play a part in the increase, but when was the last time gold was above $2,300 during the last spring vacation or summer break?
The Fed can try and tell us everything is OK or going to be OK, but not when the yield on the 10-year continues to rise — it’s the benchmark for borrowing rates on everything from mortgages to corporate loans. It spiked to 4.5% last week, its highest level since October, and continues to push higher.
Clearly, the narrative changed after the CPI report about where the Fed’s policy is headed. And guess what? The government has another $386 billion of bonds in May. In the first 3 months of 2024 the US sold $7.2 trillion of debt — the largest quarter on record and higher than the second quarter of the 2020 Covid-19 stimulus. Today the US government prints $1 trillion every hundred days and last week JPMorgan’s Jamie Dimon warned that multiple challenges, primarily inflation and war, threaten an otherwise positive economic backdrop.
He also noted “persistent inflationary pressures, which may likely continue” and noted the Federal Reserve’s efforts to draw down the assets it is holding on its $7.5 trillion balance sheet. “We have never truly experienced the full effect of quantitative tightening on this scale and the “unsettling” global landscape, including “terrible wars and violence,” is one such factor introducing uncertainty into both JPMorgan’s business and the broader economy.”
I told the PitBull that I think Dimon is a straight shooter and he agreed and said he’s just telling it like it is.
Our Lean
As I said it’s very fluid and every move is front-run by the headline news algos. There are 12 economic reports, 11 Fed speakers and Jerome Powell speaks at 1:15 Tuesday. And don’t forget, earnings pick up this week too.
Our Lean: With the ES selling off 135 points from Wednesday’s high to Friday’s low and Iran’s missiles being shot down, there is a high probability we see higher prices today. There is an abundance of shorts and buy stops above 5200. If the ES gaps higher there could be some selling on the open, but I think it’s a “buy-the-pullbacks” kind of day while keeping an eye on the bonds.
Here are some studies by HandelStats:

S&P market cap

NDX Market cap
MiM and Daily Recap
ES recap
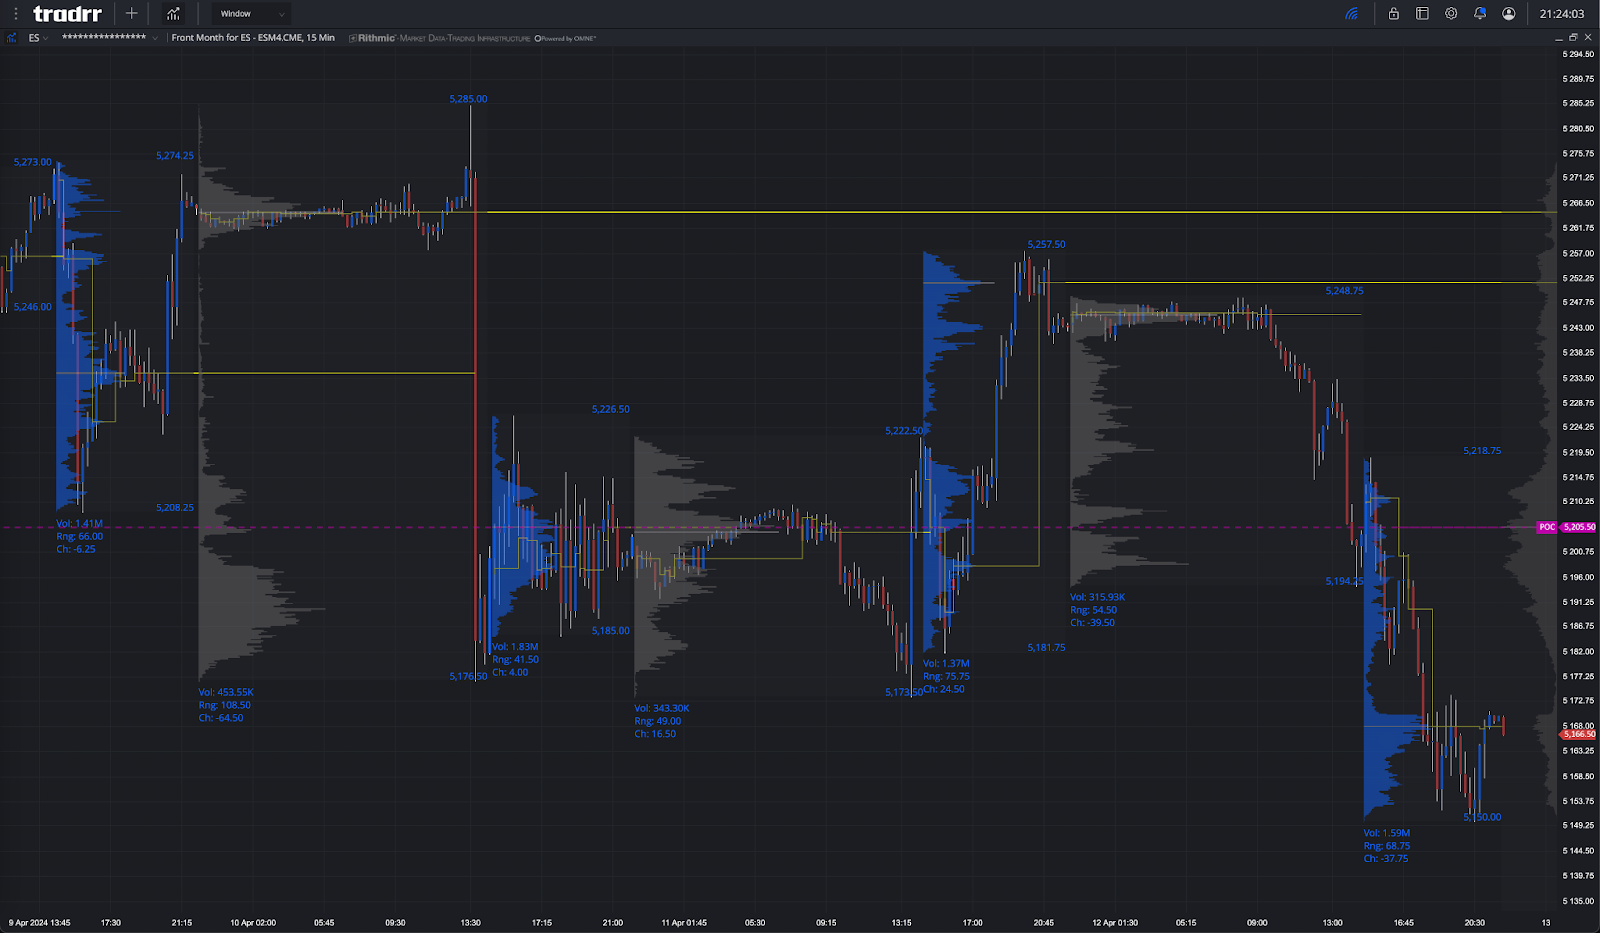
After Thursday’s big turnaround and closing drop, the ES traded up to 5248.50 and sold off down to 5194.25 at 9:15 am. Then Jamie Dimon warned of geopolitical risks and CBS news warned that Iran was preparing to attack Israel, and the ES opened Friday’s regular session at 5204.25. After the open, the ES traded 5198.00, rallied up to 5218.75 at 9:50, and then reversed lower and sold off down to 5179.75 at 11:00. After the low, the ES rallied up to 5194.25, then rallied up to 4200.75 at 11:40 and then another wave of sell programs hit the NQ and the ES sold off down to 5252.25 at 1:40. The ES rallied up to 5174.00 at 2:20, slid down to 5150.00 at 3:20 and just a few minutes before that I posted this in the MrTopStep chatroom:
-
IMPRO : Dboy : (Fri:3:18:57 PM}) : NQ not breaking
-
IMPRO: Dboy : (Fri:3:19:21 PM}): not making headway on the NQ short
Then the ES rallied up to 5160.25 at 3:30 and that’s when I posted this in the MTS chatroom:
-
IMPRO : Dboy : (Fri:3:30:16 PM}) : NQ not going for it
-
IMPRO : Dboy : (Fri:3:30:31 PM}) : it’s not going down
The ES sold off to a higher low at 5151.75. at 3:40 and then rallied up to 5168.50 at 3:45. The ES traded 5167 as the 3:50 cash imbalance showed $2.1 billion to buy and traded 5167.75 on the 4:00 cash close. After 4:00, the ES rallied up to 5171.00 at 4:10 and settled at 5167.00 on the 5:00 futures close, down 76.25 points or -1.45%, the NQ settled at 18,171.75, down 312.50 or -1.69%, the 10Yr Note (ZNM4) settled at 108.165, up 38 points +0.38%, the 30 Yr bonds (ZBM4) settled at 115.26, up 18 points or +0.49%, May Crude oil (CLK4) settled at 84.45, up .43 cents or +0.51%, Gold (GCM4) settled at 2,360.20, down 12.5 points or -0.53% on the day.
In the end, the markets got spooked by the ongoing conflict between the Israelis and Iran. In terms of the ES’s overall tone, it was weak. In terms of the ES’s overall trade volume was high: 327k ES traded on Globex and 1.574 million traded on the day session for a total of 1.901 million contracts traded.
Technical Edge
-
NYSE Breadth: 7.5% Upside Volume (!!)
-
Nasdaq Breadth: 25% Upside Volume
-
Advance/Decline: 15% Advance (!)
-
VIX: ~16.50
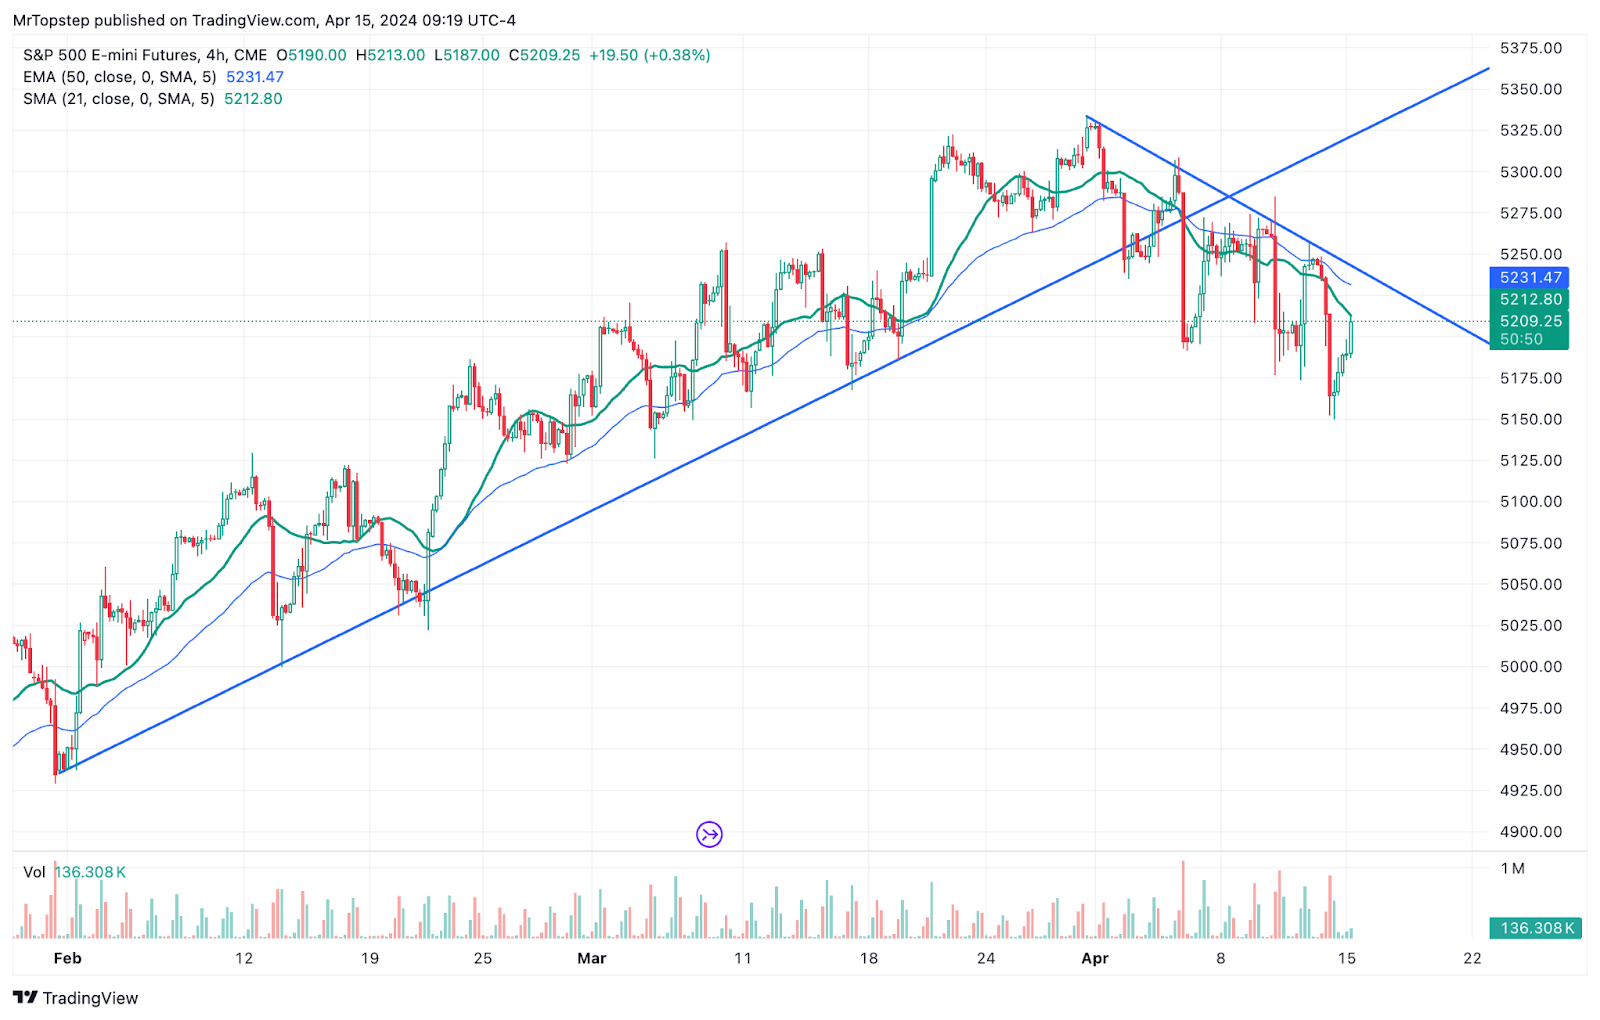
ES Hourly
Economic Calendar
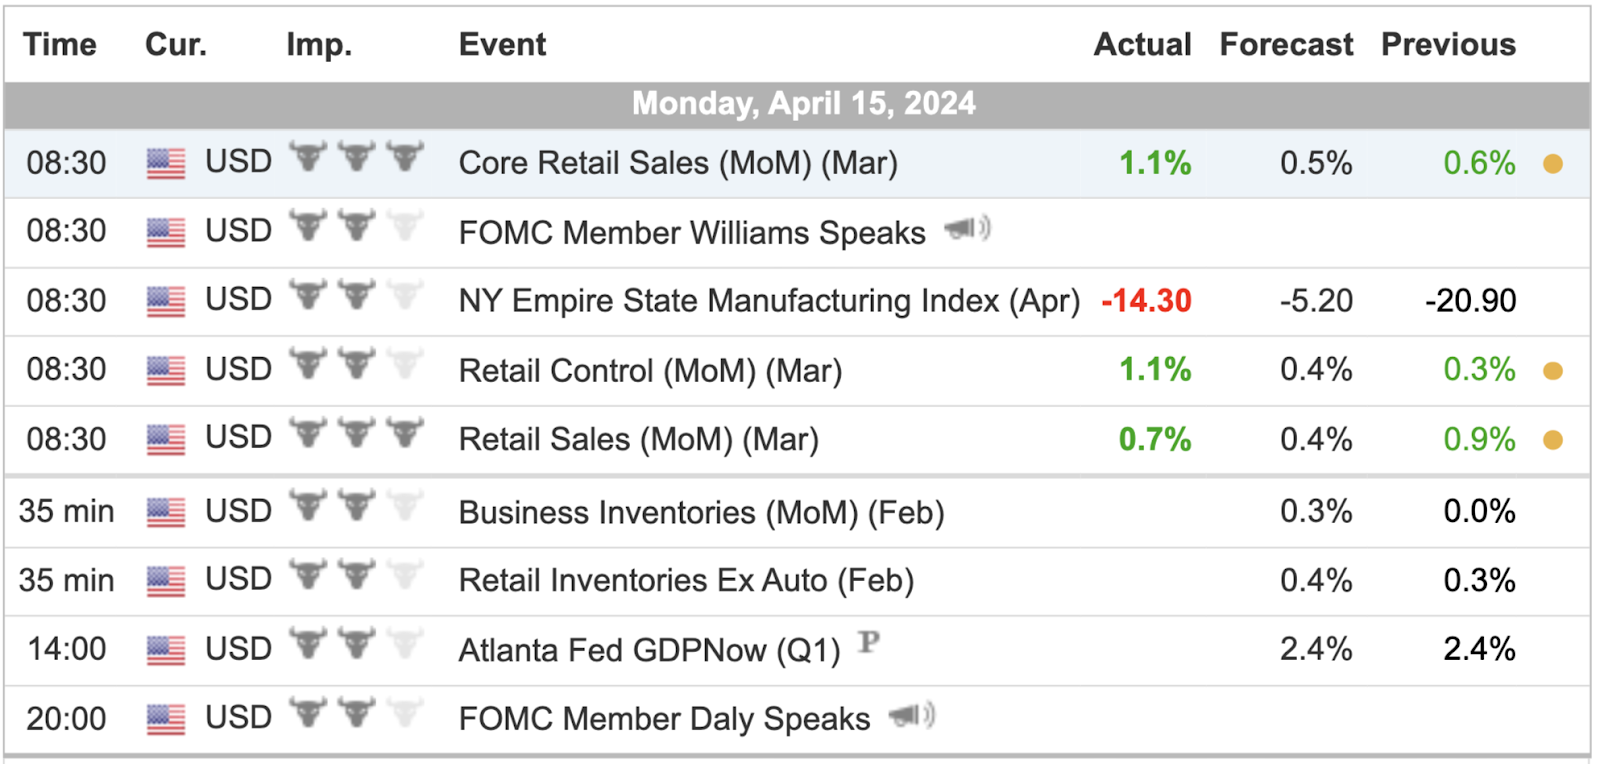
For a more complete Economic Calendar see: https://mrtopstep.com/economic-calendar/
Comments are closed