Can Stocks Rally Despite a Hot CPI Print?
Follow @MrTopStep on Twitter and please share if you find our work valuable!
Every week, MrTopStep invites traders to an “Own the Close” contest where the closest guesstimate where the SPX will settle on Friday’s 4:00 cash close.
The winners get a free week’s access to the MrTopStep Chat and trading tools. Enter your guess now!
Our View
What happens when the ES sells off before a Consumer Price Index? Well in yesterday’s case it rallied, but the question for Tuesday is, what will happen today?
It’s fair to say that March is known for its knockdowns, but will it stay down? All I know is the stats are slightly positive going into this morning’s number. Even though the print came in hot, equities are rallying. Can they continue that? Keep an eye on bonds and yields, as well as the US dollar (More on this in the guest post).
I’ll be honest, I don’t know how the ES will react to this. A hot print last month resulted in a knee-jerk dip, but then a quick bounce back to new highs. However, I expect an increase in volatility going right into today’s session and FRY-day’s March Triple Witching and its record $2.7 trillion in expiring options.
Here is what we know, the trend is still higher but we are in a seasonally weak month that is known for its drops. Meaning I don’t think we go straight back up without some further drops — but yesterday’s rally was impressive.
Our lean: Ideally I want to get a look at the CPI number first, but my gut says we are going to make new highs. You can sell the early rallies and buy the pullbacks or just be patient and buy the pullbacks.
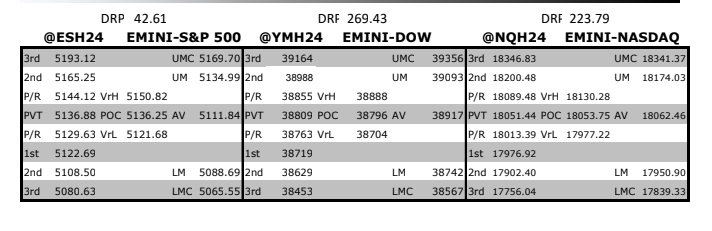
MrTopStep Levels:
MiM and Daily Recap
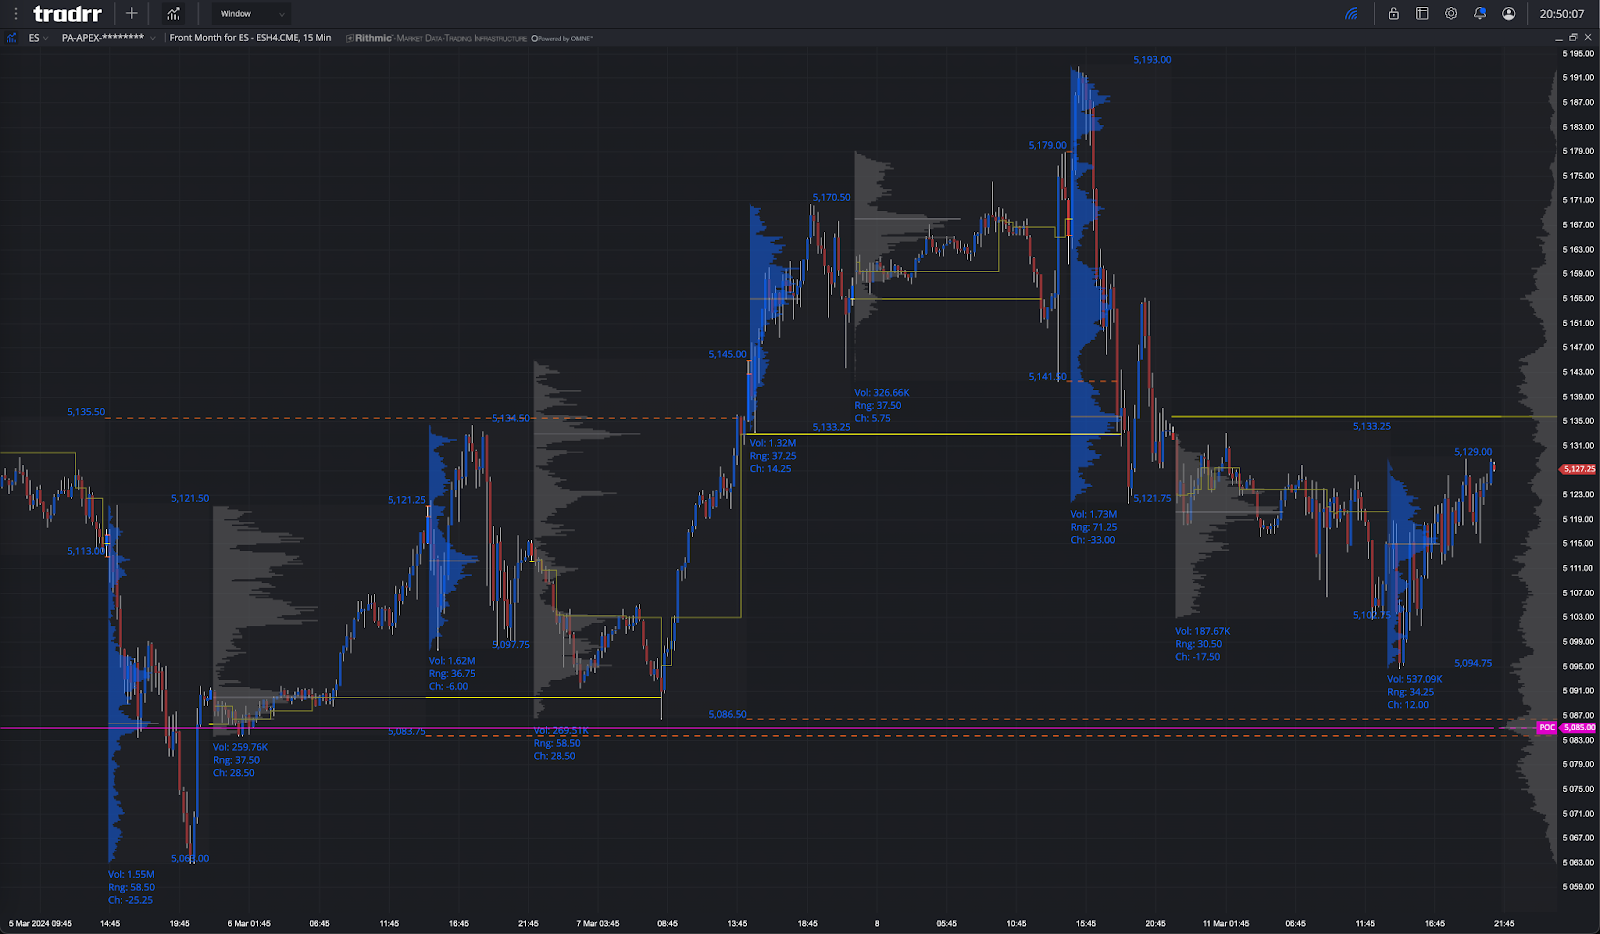
ES recap
The ESM traded up to 5196.00 on Globex and opened Monday’s regular session at 5176.50. After the open, the ES rallied up to 5182.50 at 9:31, traded down to 5157.00 at 10:15, and then rallied up to a lower high at 5180.75 at 11:07, dropped down to 5167.50 at 11:14, traded back up to the 5173.25 at 11:22 and then dropped down to the 5163.50 level at 11:31. Needless to say it was another choppy day on a list of many.
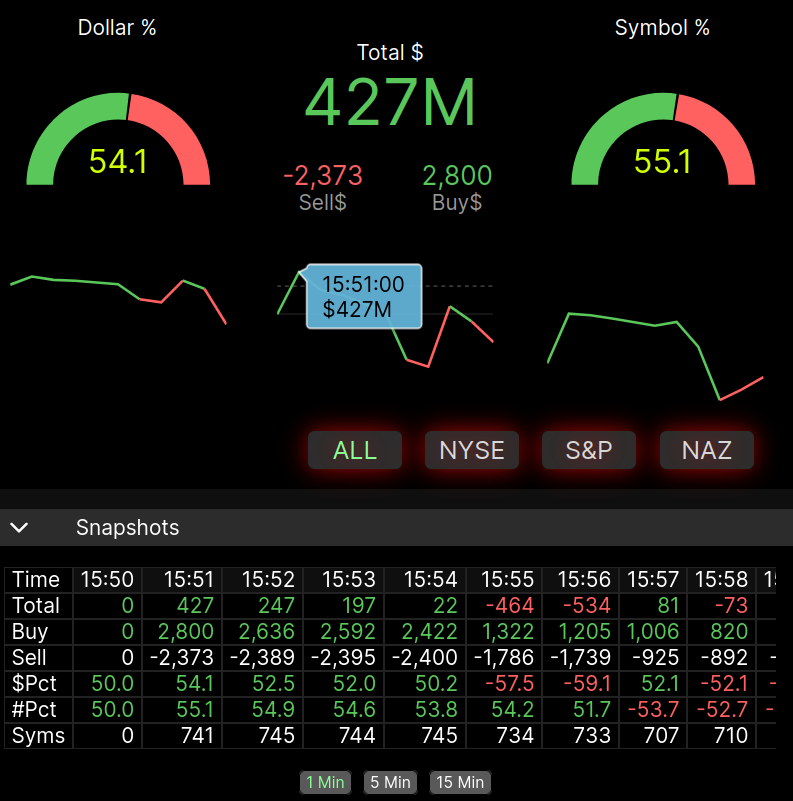
After the low, the ES rallied up to the 5181.00 level, pulled back to the 5171.50 level at 12:12, and traded up to 5188.00 at 1:33, and then sold off down to 5180.75 at 1:33 and then down to the VWAP at 5175.25 at 1:50 and then bounced back up to the 5191.50 level at 2:51. The ES pulled back to 5179.50 at 3:40, traded back up to 5188.50 and traded 5181.50 as the 3:50 cash imbalance showed $427 million to buy and traded 5186.00 on the 4:00 cash close. After 4:00 the ES rallied up to 5187.75 and settled at 5191.00, down 1.5 points or -0.03% and the NQ settled at 18,224.50 on the 5:00 futures close, down 53 points or -0.29% on the day.
In the end, selling the early rallies was correct, but if you follow the PitBull’s rule, the ES/ NQ tends to close in the direction they start out — or in this case, going up. In terms of the ES’s overall tone, it was firm. In terms of the ES’s overall trade, as expected, volume was lower: 206k ES traded on Globex, and 1.984 million traded on the day session for a total of 2.19 million contracts traded.
Technical Edge
-
NYSE Breadth: 55% Upside Volume
-
Nasdaq Breadth: 49% Upside Volume
-
Advance/Decline: 49% Advance
-
VIX: ~14.50
Guest Post — Niels at Tradrr
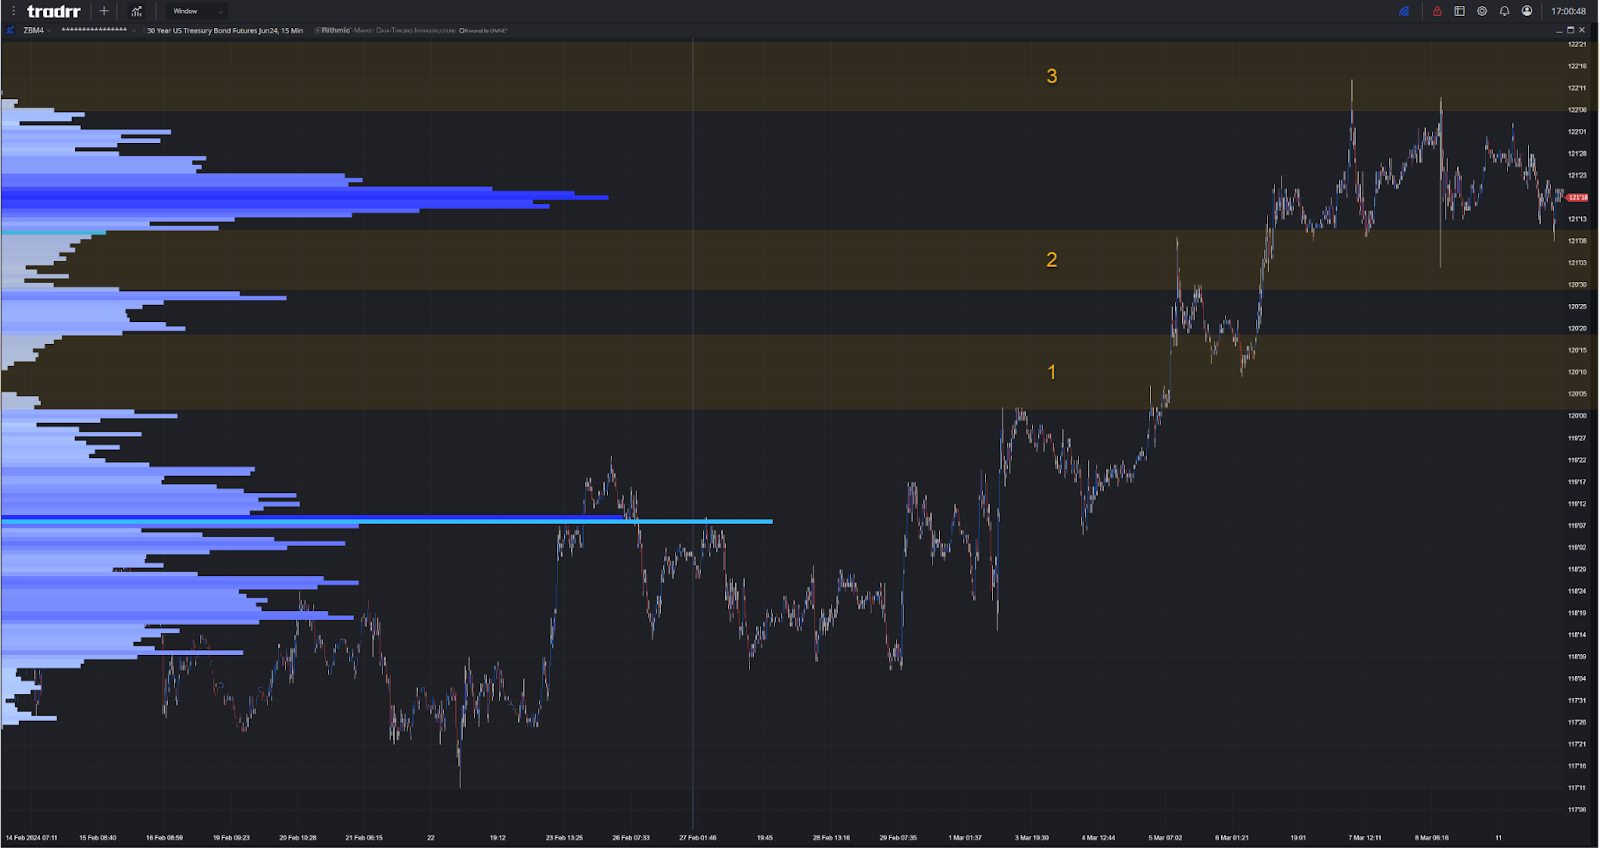
With CPI and PPI on deck this week, Treasury futures continue to be “in play” for the market and all its respective correlations. Understanding how the Treasuries are moving can aid most ES/NQ traders having their volume split this week due to the roll.
1- Starting this month, strong bonds rallied through its first full week giving us the most important low value zone protecting the POC of lower and the trapped participants that could be found therein.
2- The low volume area formed from the high end of 120’s till the low end of the 121’s provides and area of interest from moving these prices lower where when doing so gets us back into the Value area from this defined time period and opens us up to testing the area from segment 1.
3- Above the 122’s we left some excess from attempting higher placing the current price in a state of balance.
Economic Calendar

For a more complete Economic Calendar see: https://mrtopstep.com/economic-calendar/
Comments are closed