Our View
I have been trying really hard to cut back on the Daily Recap, but there is a problem, writing it keeps me in tune. It helps give me a feeling of the direction and while I’m sure I’d still have a good feeling, I don’t want to disrupt things. I know, sounds old school right? Well maybe it is, but reading my imbalance charts is as close to me as reading the quote boards on the floor in the S&P pit.
It’s called pattern reconciliation and something that has unequivocally been the mainstay of my trading. It’s by no means foolproof, but if you asked anyone in the MTS chat what happens after the markets rally and I say “NQ sell imbalances showing up,” they will tell you a high percentage of the time it’s the high.
People saying this market is easy to trade or navigate are also the ones looking to sell you a bridge. This stuff is tough — and that’s coming from someone who was on the trade floor for more than three decades. It ain’t easy!
Our Lean
Yesterday we got the range break we’ve been looking for. Once 4070 failed, the ES quickly traded down to our 4020 target. Not bad for a Thursday afternoon. From here, the ES may not fully break down until after the CPI number, but if it should rally off the report, I think you sell it.
There are zero redeeming qualities to the stock market right now, so at least for me it’s not a “wait to buy the dip” thing. Instead, it’s about selling the rips. If you can’t hold the futures, maybe look at some September puts.
I think it’s not a question of if the ES will fall, it’s when.

Look at the 4-hour chart of the ES above. Zero traction in either direction until we got the range break.
The PitBull rule is to look for a low on the Thursday or Friday the week before the Quad Witch expiration — that’s yesterday and today. However, the CPI report, which is now more closely followed than the jobs report, muddies the situation.
While there have been a lot of Thursday late-day lows, it also can come late on Friday and then the markets bounce on Monday. All sorts of our rules are crisscrossing; like the rule that says the ES tends to go sideways to higher after a big down day, or the early week/early day rallies in a bear market.
I’m not bullish, but I can’t rule out some type of rally. The 50% retracement from yesterday’s high to low is 4080. The breakdown spot from yesterday was 4070. So somewhere in that range, I would look to start selling. 10 to 15 points above the top of that range should be stiff resistance.
Daily Recap
The ES opened Thursday’s regular session at 4095. After the open, the ES traded down to 4088.25, rallied up to 4109.25 at 9:34, dropped down to a new low at 4085, and then rallied up to 4118.25 at 10:00. Very choppy action early on.
After the rally, the ES drifted down to the 4091 level and traded back up to 4114.50 at 10:32. Just after that, a sell program hit the futures, pushing them back down to the 4081.75 level at 11:00, and then the ES rallied back up to the 4104.50 area at 11:45.
At 1:05 the ES hit a high of 4110.25 and then proceeded to break to 4083.75. From there, it went to 4096 at 1:55 and then flushed straight down into the 3:50 cash imbalance.
At 3:49 the ES traded 4025.50 as the 3:50 cash imbalance showed $3.2 billion to sell, rallied a little, then sold off down to new lows and right down to my 4020 stop run level I talked about in yesterday’s ‘Our Lean’ section. It closed at 4014.75 on the 4:00 cash close and settled at 4023 on the 5:00 futures close, down 98 points or 2.4% on the day.
In the end, the momentum was down and you could see it early on. In terms of the ES’s overall tone, it was weak. In terms of the ES’s overall trade, volume was light early in the day but picked up as the markets fell, a total of 2.02 million contracts traded.
- Daily Range: 129.50 points
- H: 4144.50
- L: 4014.75
Technical Edge
- NYSE Breadth: 93% Downside Volume (!!)
- NASDAQ Breadth: 65% Downside Volume
- VIX: ~$26.50
It has taken seemingly forever, but we finally got it: A break of the range. Last week’s low and recent support at 4070 broke ahead of the CPI report and we got a downside flush on 90%+ downside volume.
As a repeat from yesterday, “the next 6 sessions are not set to get any easier and should create a bit of chaos. Chaos usually does not favor the bull case, but we will see how it shakes up.”
The schedule includes:
- June 9th is “roll day” for the futures, as we move to Sept. contracts from June.
- June 10th is the CPI report, which has become the most important economic data point for traders.
- June 14th is the PPI report.
- June 15th we have retail sales, but more importantly the FOMC release and likely a 50 bps rate hike (there is currently a 10% chance of a 75 bps hike).
- June 17th is quad-witch expiration.
Game Plan — S&P 500 (ES and SPY), Nasdaq (NQ and QQQ), Oil, XLE, XOM
S&P 500 — ES

The ES had the robust move off the lows, then consolidated for 8 sessions, before breaking lower on the 9th session.
This chart has been burned into your mind by now, I’m sure! But look at how it broke 4070, triggering a landslide of stop-losses on its way to the downside.
Now trying to find its footing near 4000 and the 50% retrace, the levels are still clear. A rally back to the 4070 area — the breakdown spot and the 10-day — is suspect, unless it can reclaim this zone ahead of the weekend.
If 4000 breaks lower, the 61.8% retrace is in play near 3060.
S&P 500 — SPY

Same situation with the SPY as it broke down too.
On the downside, watch $399 to $400 — the 50% retrace. Below that puts $394 to $395 in play.
On the upside, a rally to the $407 to $408 area is suspect, unless it’s reclaimed.
Nasdaq — NQ
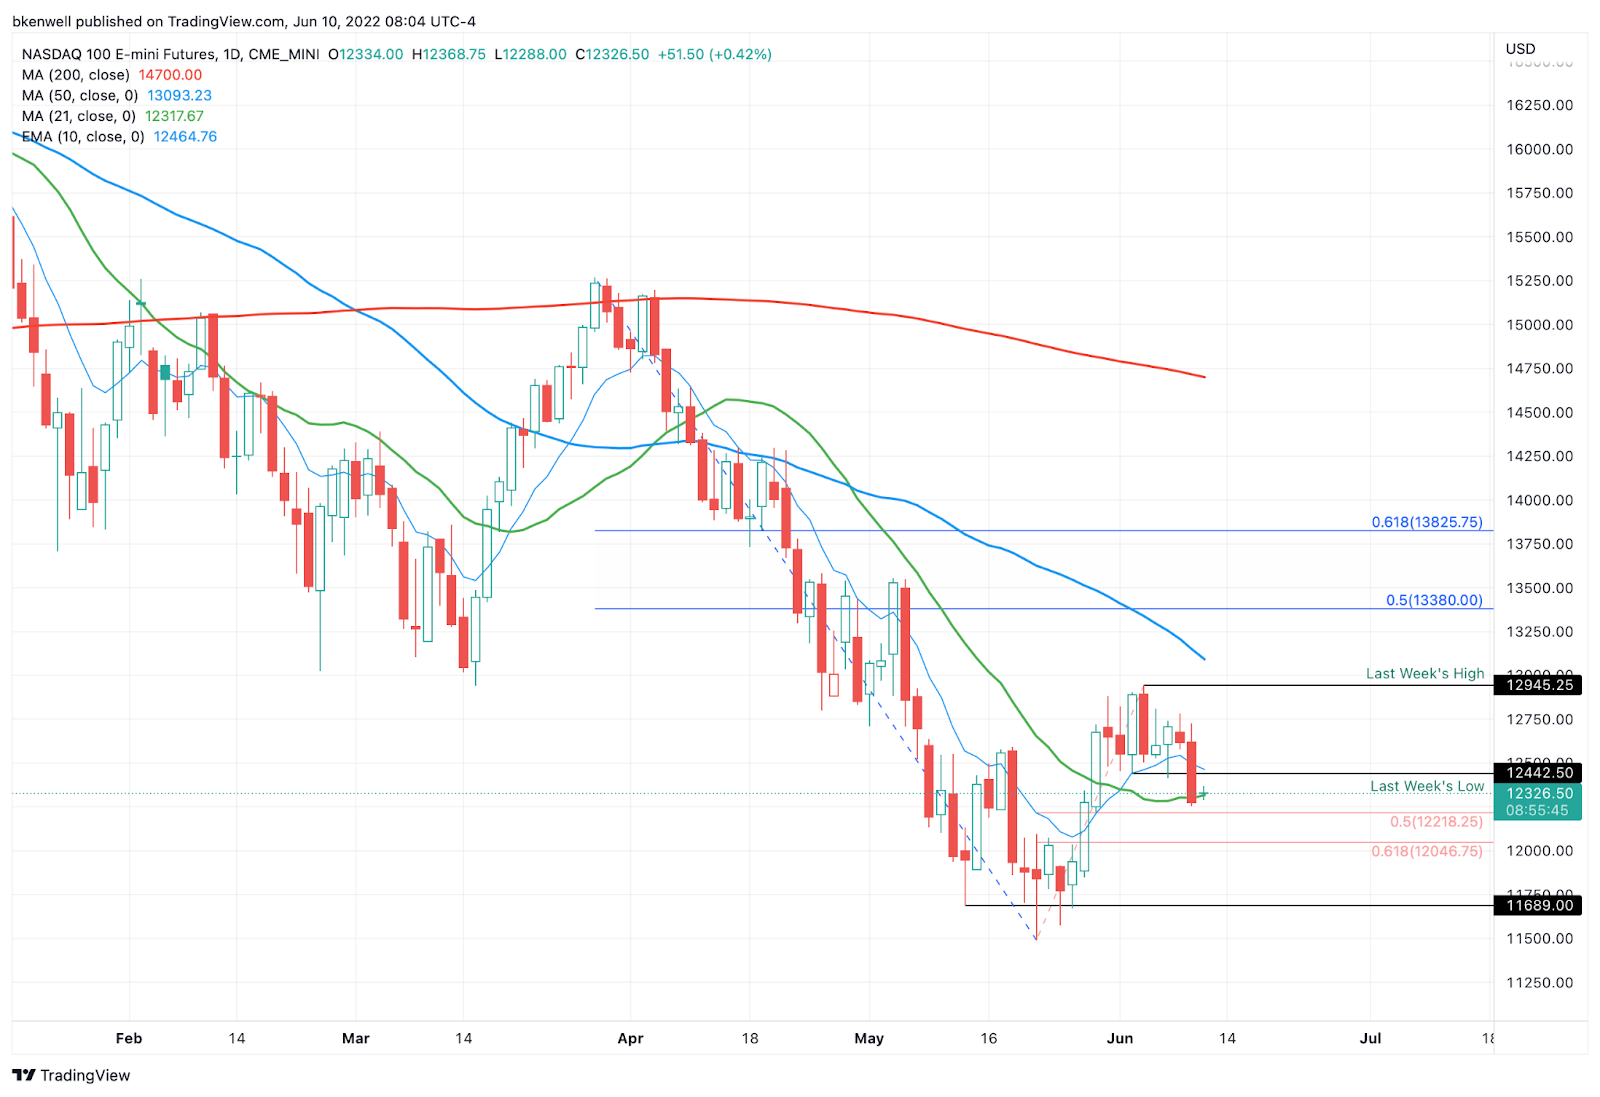
NQ broke last week’s low, which now puts 12,200 to 12,225 in play. Below that opens the door down to 12,000 to 12,050.
On the upside, bulls need a move above 12,450 to 12,500 to undo Thursday’s damage.
Nasdaq — QQQ

Above $303 to $304 is needed to undo the damage on the QQQ.
On the downside, watch $297 to $297.50, then $293 to $293.50.
Oil — CL

While great for the commodity bulls, the rally in oil is crippling the consumer.
As it bumps up against our $122.50 target — the 78.6% retrace — bulls are looking for a breakout. Above it opens the door to the $127.50 to $130 area.
On the downside, watch the 10-day moving average, followed by the $115 to $116 zone.
XLE
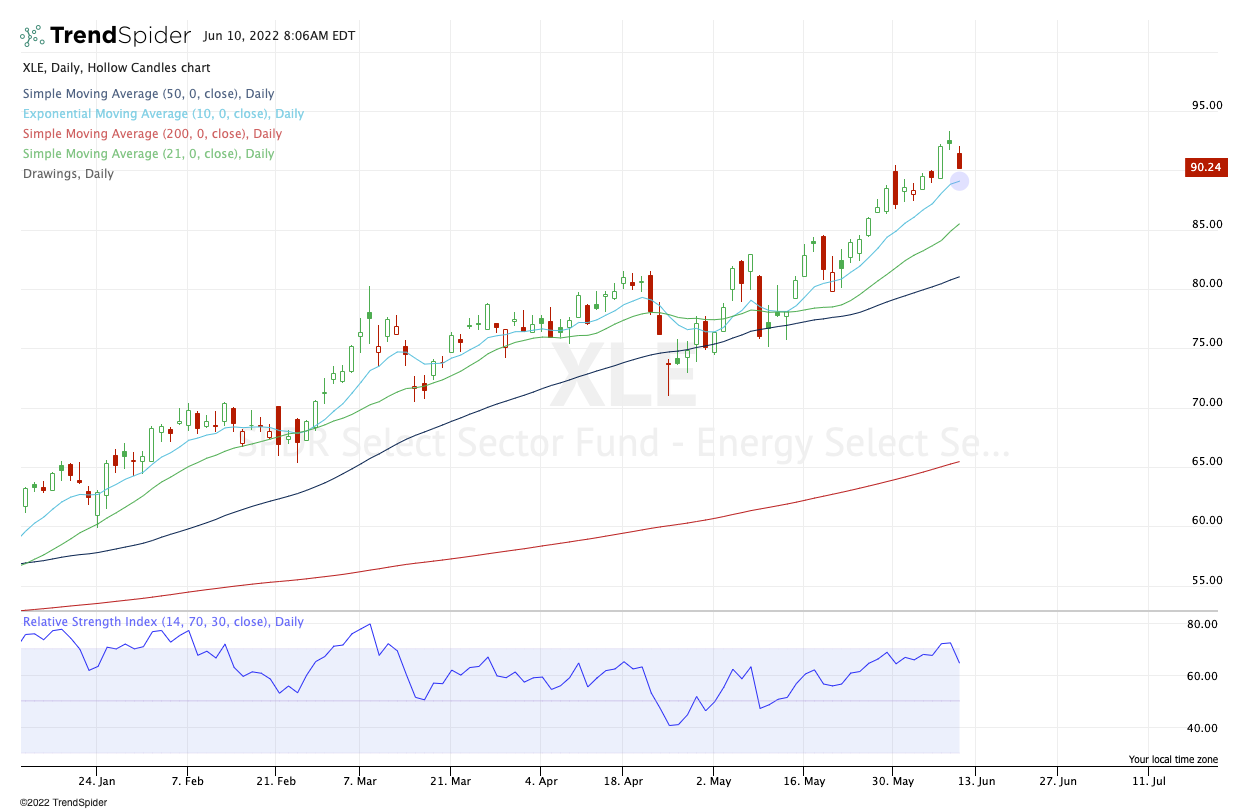
Energy will eventually correct. It always does in these cycles. Either supply will catch up or demand will wither away as the consumer gets pulverized.
Until that happens though, bulls can buy the dips near active support. For the XLE, that comes into play near the 10-ema. A bounce and hold could open the door to $100.
If that dip fails, I may be looking for a larger pullback down to the 21-day moving average and the $85 level.
XOM

Looking to buy a dip here near a nice trifecta: $100, prior resistance and the rising 10-day ema.
Go-To Watchlist — Individual Stocks
*Feel free to build your own trades off these relative strength leaders*
- Numbered are the ones I’m watching most closely.
- Bold are the trades with recent updates.
- Italics show means the trade is closed.
- AMD — First target achieved at $109.50. → Stopped at B/E or $100, whichever traders were using.
- DXY / UUP — Trimmed into $27.50 as the first target. Now looking for $27.70 to $27.75. This tends to be a slow mover and it is one we can hold for a while as long as our risk level holds.
- DLTR — Price Target 1 & 2 hit on the same day it triggered → Now look for $165 to $166 on remaining balance. B/E Stop.
- NEX — Trimmed at $12.50, stopped at B/E or $11.50 (for aggressive bulls)
Relative strength leaders (List is cleaned up and shorter!) →
- These are on watch for dip-buys:
- XLE
- AR
- XOM
- TECK
- DLTR
- AMD — watch $104.55 (monthly-up)
- IBM (of all names)
- DOW
- ARCH
- NVA
- XLU
- TMST
- VRTX — trying for weekly-up this a.m.
- AMGN
- MRK
- MCK
- BMY
Economic Calendar
A lot of stuff on the list, but seemingly the only thing that matters is the CPI report. Sentiment also seems relevant, given worries of a recession.

As we all know, there’s no crystal ball when it comes to trading stocks, options, or futures. But the Market Imbalance Meter may be as close as it comes. Knowing how the “Big Money” is placing its bets can give our trading room a big wave to ride — or a warning sign to stay out of the water. Come check it out now, risk-free for 30 days.
Comments are closed