All eyes are shifting toward the Fed.
Follow @MrTopStep and @BretKenwell on Twitter and please share if you find our work valuable.
Don’t Forget: The Long-term performance of the S&P 500, some longer-term setups, and 5 red flags that showed up before the 2022 bear market.
Our View
Today is the last trading day of October and it’s Halloween, while tomorrow marks the first trading day of November and the Fed’s two-day meeting.
According to the Stock Trader’s Almanac, November begins the best six months for stocks and is the second-best month for the Dow and S&P (the Dow has rallied 4,200 points since it made its low on October 13th.
When we combine the day before and the day after Thanksgiving, there are only 18 losses in the last 69 years. While that doesn’t impact us immediately, it’s something to keep in mind as the holiday is only a few weeks away.
Our Lean — Danny’s Take
I am long the ES at 3805.50. While many people may think I have been wishing the markets would go lower, I have always been a bull market guy. Long-time readers know this about me and while I may have seemed negative and pessimistic this year, it’s only because that’s what the tape has been telling me.
Being long or trying to be long is usually a good idea because that is the general long-term trend of the market. However, that has not worked out really well this year and as much as it is unnatural for me, I’m glad we have been a bit more cautious and bearish.
As I said last week, there are a lot of traders I follow that are talking about a melt-up going into the end of the year. Now some are saying the ES can rally all the way up to ES 4300. I am going to try and stay long, but I am also going to take this one day at a time.
As for today, we have a rule that says the ES “tends to go sideways to lower after a big up day.”
Daily Recap

The ES traded down to ~3777 on Globex and opened Friday’s regular session at 3815.50. Right out of the gate, it was a bull train.
After the open, the ES rallied up to 3850 at 9:42, back and filled for the next 15 minutes, traded up to a new high at 3855 at 10:00, and dropped down to 3829.50 at 10:13. From there, it rallied up to a new high at 3883.50 at 11:13.
From there, it fell about 14 points down to ~3869, then rallied all the way up to 3902, pulled back down to 3892.75 at 2:11, and ripped up to 3913.75 at 3:03. The ES pulled back to the 3904 level at 3:08, back and filled a bit, traded 3910 as the 3:50 cash imbalance showed $2.033 billion to buy and traded 3910.75 on the 4:00 cash close. After 4:00, the ES rallied up to 3923 on the 5:00 futures close, up 103.50 points or +2.71%, while the NQ rose 390 points or +3.47% on the day.
In the end, after several “false starts” the markets went up with a vengeance. In terms of the ES’s overall tone, it was all buy programs and buy stops. In terms of the ES’s overall trade, volume was in line with what we saw all week at 1.995 million contracts traded.
Technical Edge
- NYSE Breadth: 68% Upside Volume
- Advance/Decline: 75% Advance
- VIX: ~$27
On Friday, Oct. 21, it looked like the ES was going to roll over and potentially go on to retest the low. Instead, it reversed and rallied hard. After last Friday’s ramp, that’s back-to-back “Fry-days” with 2.4% gains. Every Friday this month has had a gain or loss in excess of 2.3%.
This week is marked by more earnings, a jobs report on Friday and most important of all, a Fed meeting on Wednesday. The Fed will raise rates again on Wednesday — the market is pricing in another 75 basis point hike — but the rhetoric for futures hikes will be critical.
If some sort of “pivot” language is included, the market will rip. If Powell gives us another round of “Jackson Hole” commentary, well then the October low remains in play.
Notes: See if oil catches a bid here in the $86 region. Bonds pressured this morning, dollar is up.
S&P 500 — ES
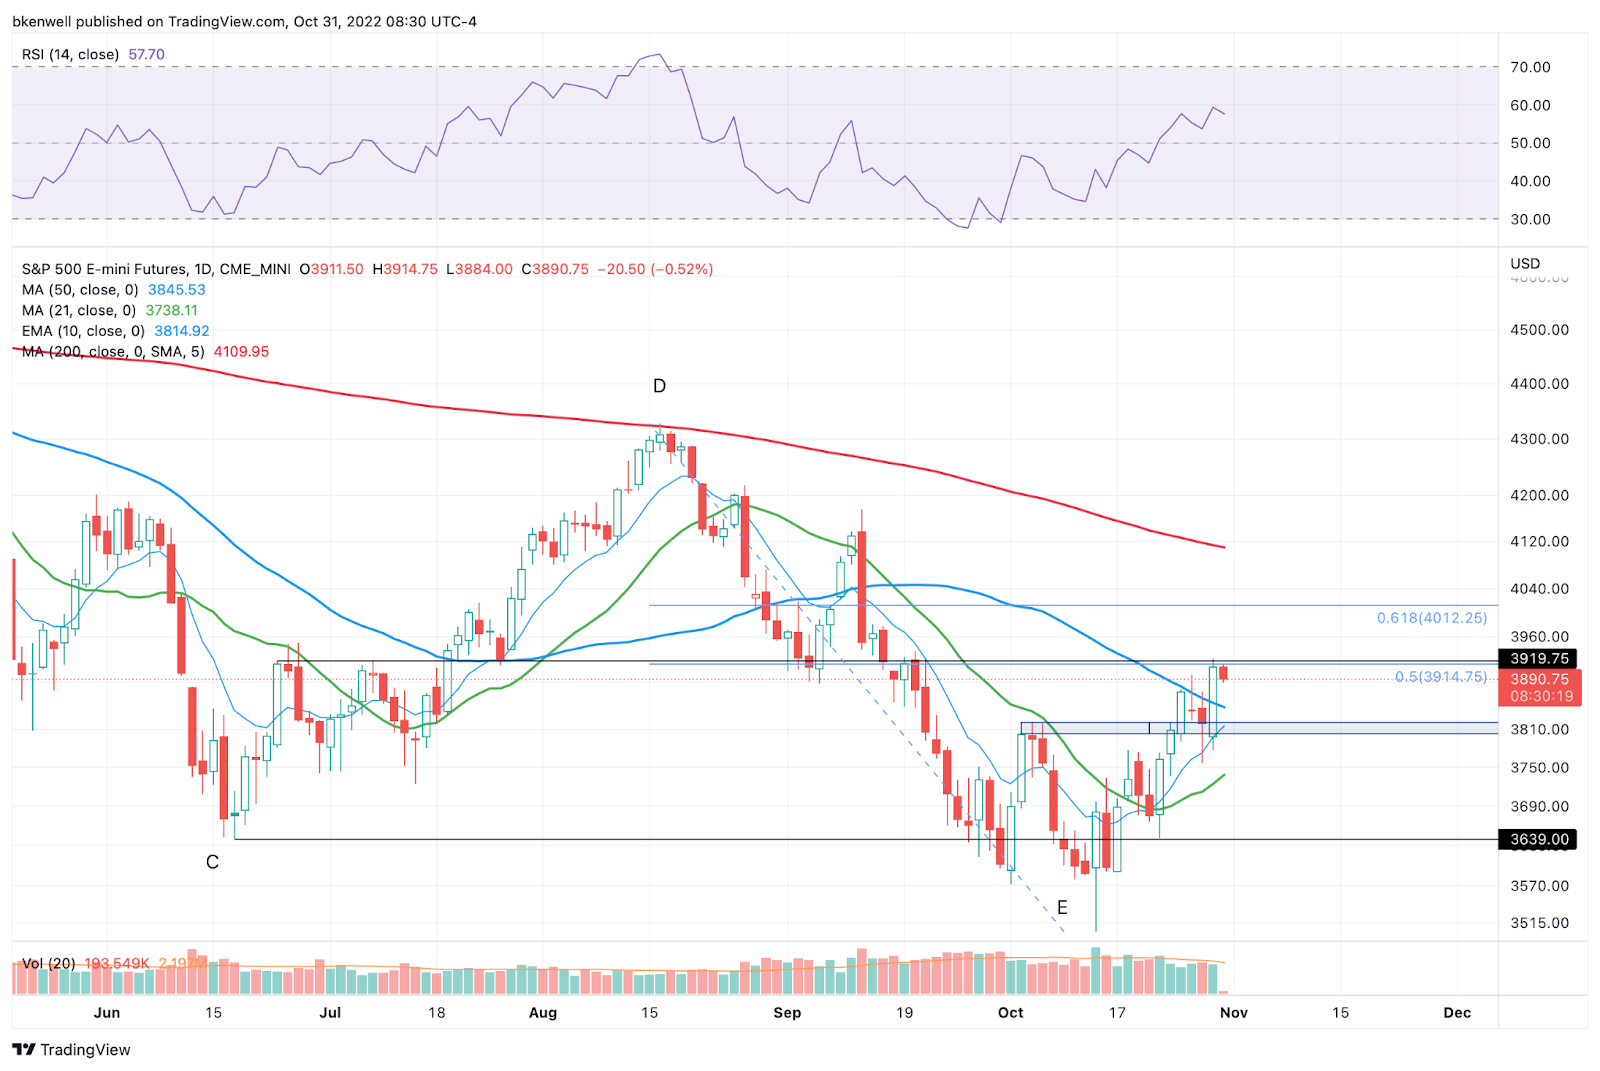
Well, we got our move to 3850…and a whole lot more! The ES roared up to the key 3900 area on Friday, a level that, quite frankly, I wasn’t expecting to get hit that day.
As you can see on the chart above, ~3920 is a key level to keep an eye on now. It has not only been a pivotal support/resistance level since June, but it also marks the 50% retracement from the October low to the August high.
Should the ES clear this area, it opens the door to 4000 and the 61.8% retracement.
On the downside, I want to see support at 3840. Below that and 3810 to 3820 is key.

If we zoom into the H4 chart, I’m also keeping a close eye on the 3865 to 3875 area.
There we have the 10-ema and a key resistance area from last week. Will it act as support? That’s what I want to see.
S&P 500 — SPY

$390 is a key area. It makes a prior pivot, the 50% retracement, and the 21-week moving average.
If the SPY can clear this level and stay above it, then $400 is in play.
If it pulls back, the 50-day is the first area of interest around $383, followed by the $379 to $380 area. That was resistance earlier this month, support last week and almost marks the 10-day moving average.

On the H1 chart, let’s see how this morning’s gap down (currently about 0.5%) is handled. I am looking to see how the 10-ema near $386 is responded to.
If it’s not support, let’s watch $384.50 — the 50% retracement.
GIS

Look at that robust weekly-up rotation last week as GIS got wound tighter and tighter.
From here, I am okay riding a B/E stop and for those that don’t want to be bothered by more downside, they can be down to a ½ position here. $85 to $86 is ultimately the goal.
Go-To Watchlist
*Feel free to build your own trades off these relative strength leaders*
- Numbered are the ones I’m watching most closely.
- Bold are the trades with recent updates.
- Italics show means the trade is closed.
Open Positions
- GIS — Down to ⅔ at least, but ½ position here is now okay. B/E stop. Next trim is $82.50 to $83, then $85 to $86.
- UUP — should trim at least ⅓ on this morning’s gap-up open if you have not yet trimmed. Carrying a ⅔ to ½ position if we hit $30 is reasonable.
- Nice bounce from our entry but short-term overhead hurdles exist (10-day & 21-day, plus the gap-fill at $30.07).
Relative strength leaders →
Top Picks (these have been Robust lately):
- LNG
- MCK
- CAH
- CI
- CCRN
- GIS — Weekly-up
- LPLA
- REGN
- ENPH — it’s back on the list.
- VRTX
- UNH
- MRK, AMGN
- XLE — XOM, CVX, COP, BP, EOG, PXD
- TJX
- NOC
Economic Calendar

Comments are closed