At the very least, they are not inspiring.
Our View
The banks make up ~13% of the S&P 500 and it’s one of the top sectors in the index. I know this is not 2008, but I think we all know when the banks are weak, so is the stock market. Yesterday, JPMorgan and Morgan Stanley both missed on earnings and revenue. JPMorgan is pausing its buyback, too. CEO Jamie Dimon said it’s to meet capital requirements, but it still doesn’t look good from the headlines.
For JPMorgan: “Q2 EPS of $2.76 vs. $2.91 consensus and $3.78 in the year-ago quarter.”
This morning, Wells Fargo missed on the top and bottom line too. “Q2 GAAP EPS of $0.74 fell from $0.88 in Q1 and $1.38 in the year-ago quarter.”
Citigroup finally snapped the streak, reporting a top- and bottom-line beat this morning, but sheesh, what a bad showing so far from the banks.
The US is faced with a dilemma: Raising interest rates on its own debt and the gap between the dollar and other global currencies. On the plus side, the US is able to raise rates faster than the rest of the world, helping to combat inflation. Because of its stronger economy, it can hike faster than the UK and the ECB.
But that gap in currencies does create an issue for multinational companies who are generating profits overseas.
Our Lean
Today’s the July monthly options expiration. The stats for today are not very good, historically speaking. Over the last 38 July expiration Fridays, the S&P 500 has closed higher 17 times and lower 21 times. For the Nasdaq, it’s even worse, with a 14-24 record.
That said, the S&P 500 is down 5 days in a row already, but continues to hold the 3740 to 3750 area on a closing basis. On the upside, bulls need to clear 3800. If they can’t, the ES could struggle today.
Daily Recap
The ES opened Thursday’s regular session at 3751, printed 3757.75, sold off down to 3730.75 at 9:44 then rallied up to 3748.75 at 9:54. From there, it reversed back down to a new low at 3723.75 at 10:13. After the low, a slow grinding ‘back-and-fill’ pushed the ES back up to 3748 at 11:08 and then up to a level I thought the ES could surprisingly trade at, at 3775-3780. The futures traded 3774.75 at 11:43.
After the high, the ES dropped down to 3745.25 at 12:52 and then rallied back up to a new high at 3777.75 at 2:07, did another small round of back-and-fill, and popped up to 3791 at 2:23. It eventually traded 3800 at 3:30 as the early MIM showed $299 million to sell, traded 3789.50 as the 3:50 cash imbalance flipped to $950 million to buy and then traded up to the 3798 area just before the cash close. On the 4:00 cash close, the ES traded 3794.25 and then went on to settle at 3796 on the 5:00 futures close, down 11 points or 0.3% on the day.
In the end, the ES sold off ~200 points from last Friday’s 3922 high and bounced 72 points. It was oversold and there was some mid-month buying mixed in. In terms of the ES’s overall tone, it was oversold in the early going and firmed up as the day wore on. In terms of the ES’s overall trade, volume was steady at 1.84 million contracts traded.
- Daily Range: 82.50 points
- H: 3806.25
- L: 3723.75
Technical Edge
- NYSE Breadth: 85% Downside Volume
- NASDAQ Breadth: 50% Downside Volume
- VIX: ~$26
Game Plan: S&P 500, Nasdaq, Oil
You can usually get a good feel for the market based on individual positions.
Notice how when the S&P was trading well, we had great trades lined up with individual stocks (MRK, MCK, DG, GOOGL, AAPL).
Then our runners were getting stopped out and the number of open trades started to shrink. That’s as the index has fallen five days in a row now. Interestingly, the VIX is down two days in a row too.
DLTR has been the exception thus far, as we look to trim even more this morning. But this observation is just one more way to find “clues” on the market.
S&P 500 — ES
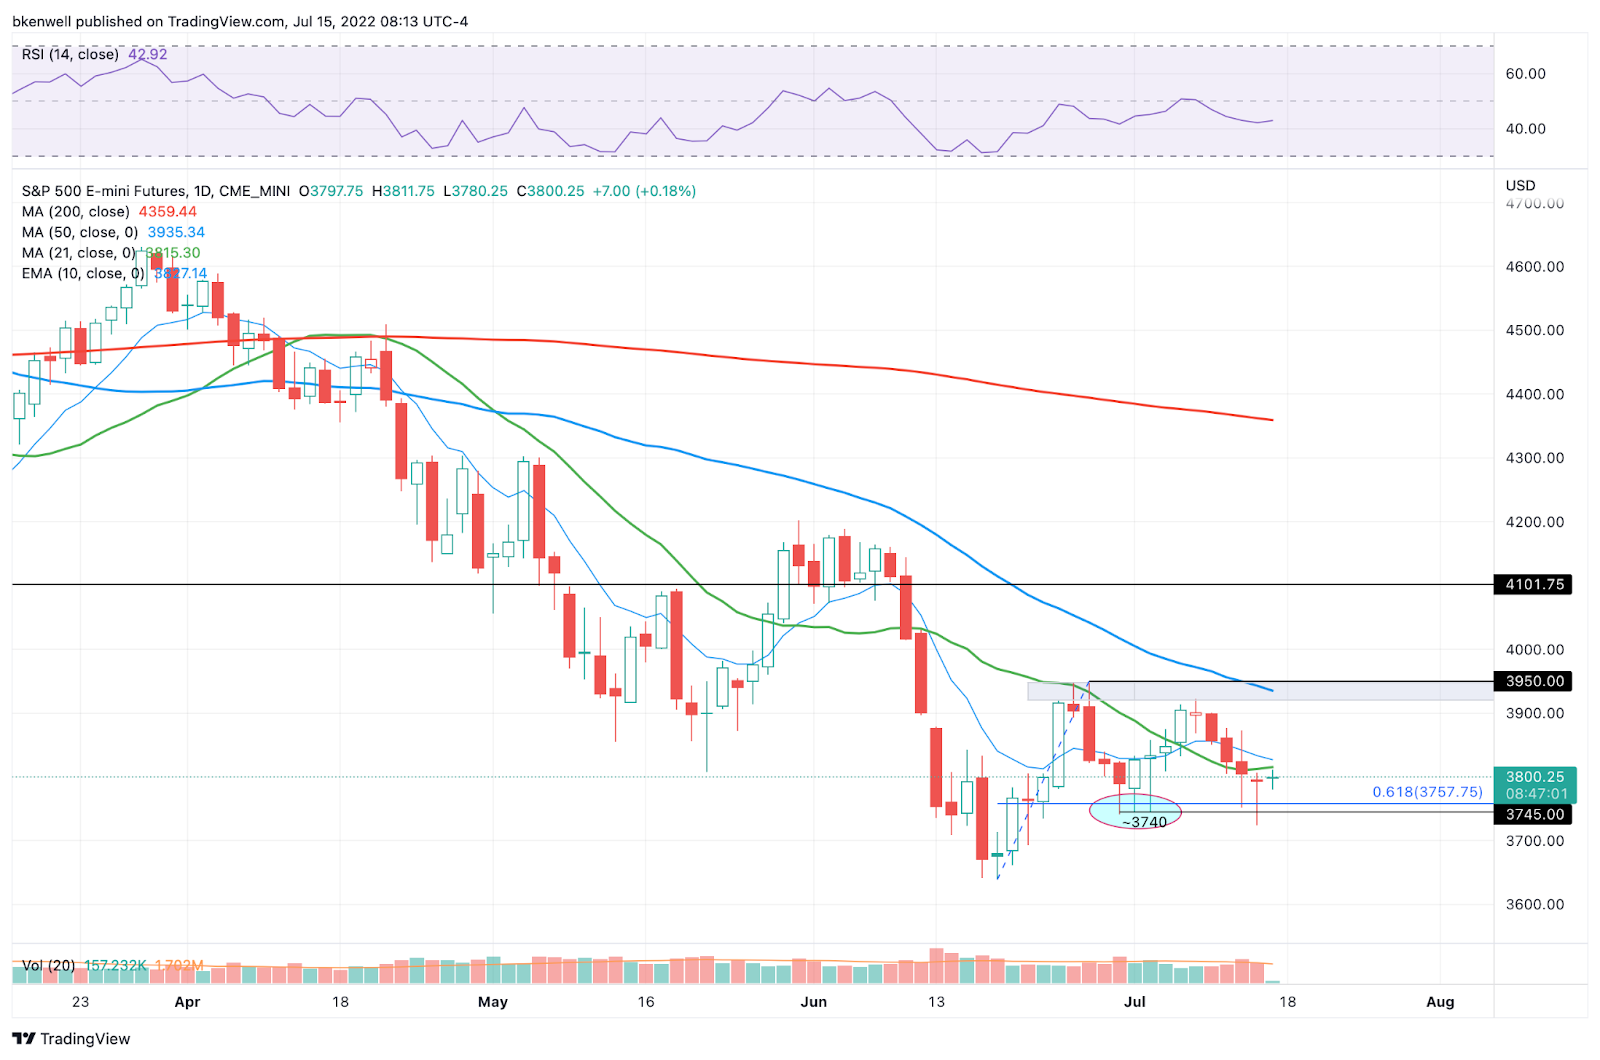
Yesterday we said: “We could see a push to 3800 today. 3800 to 3825 is a tough area of resistance right now.”
That still seems to be the case, with the Globex high clocking in at ~3812. Keep an eye on this level and see if the ES can clear 3825 — putting it back above the 10-day and 21-day moving averages.
If it can do that and sustain above 3825, I do think that could open the door back to the 3900 level and resistance between 3920 and 3950.
On the downside, it remains quite clear that 3740 is key for the bulls. It wavered yesterday, as the ES made a low of ~3724, but the futures bounced and reclaimed 3740+.
On the upside I’m watching 3800, 3812, then 3825. Over 3825 without reversing and the ES can run a bit. On the downside, I’m watching 3780, 3740, 3724, and 3705.
S&P 500 — SPY

When things get complicated, I try to get simple. $380.50 to $382 is the area to clear on the upside. Below that zone and I have a hard time getting bullish. Above that zone and $390 to $393 is in play.
On the downside, $372.90 to $374 is the zone to hold. Below that level puts yesterday’s low in play at $371. Below that and it looks quite bearish.
Nasdaq — NQ

11,525 is key on the downside, as you can see from back-to-back sessions at the lows.
On the upside, yesterday’s high at 11,835 is key. Above it creates the potential for a daily-up rotation, as well as a move over the 10-day. That puts 12,000 on the radar for me, followed by a possible push to 12,250 in the coming days.
Below 11,725 creates concern for the bulls and opens the door to 11,525. Below 11,525 puts 11,350 to 11,380 in play.
Nasdaq — QQQ

Super simple: $280 is the first layer of support, then $277. Below $277 puts the low in play and the 200-week moving average.
On the upside, over $288 today gives the QQQ potential for a 2x daily-up rotation. That’s followed by the mid-$290s.
Bears need to break $277. Bulls need to break $296.50.
Oil — CL
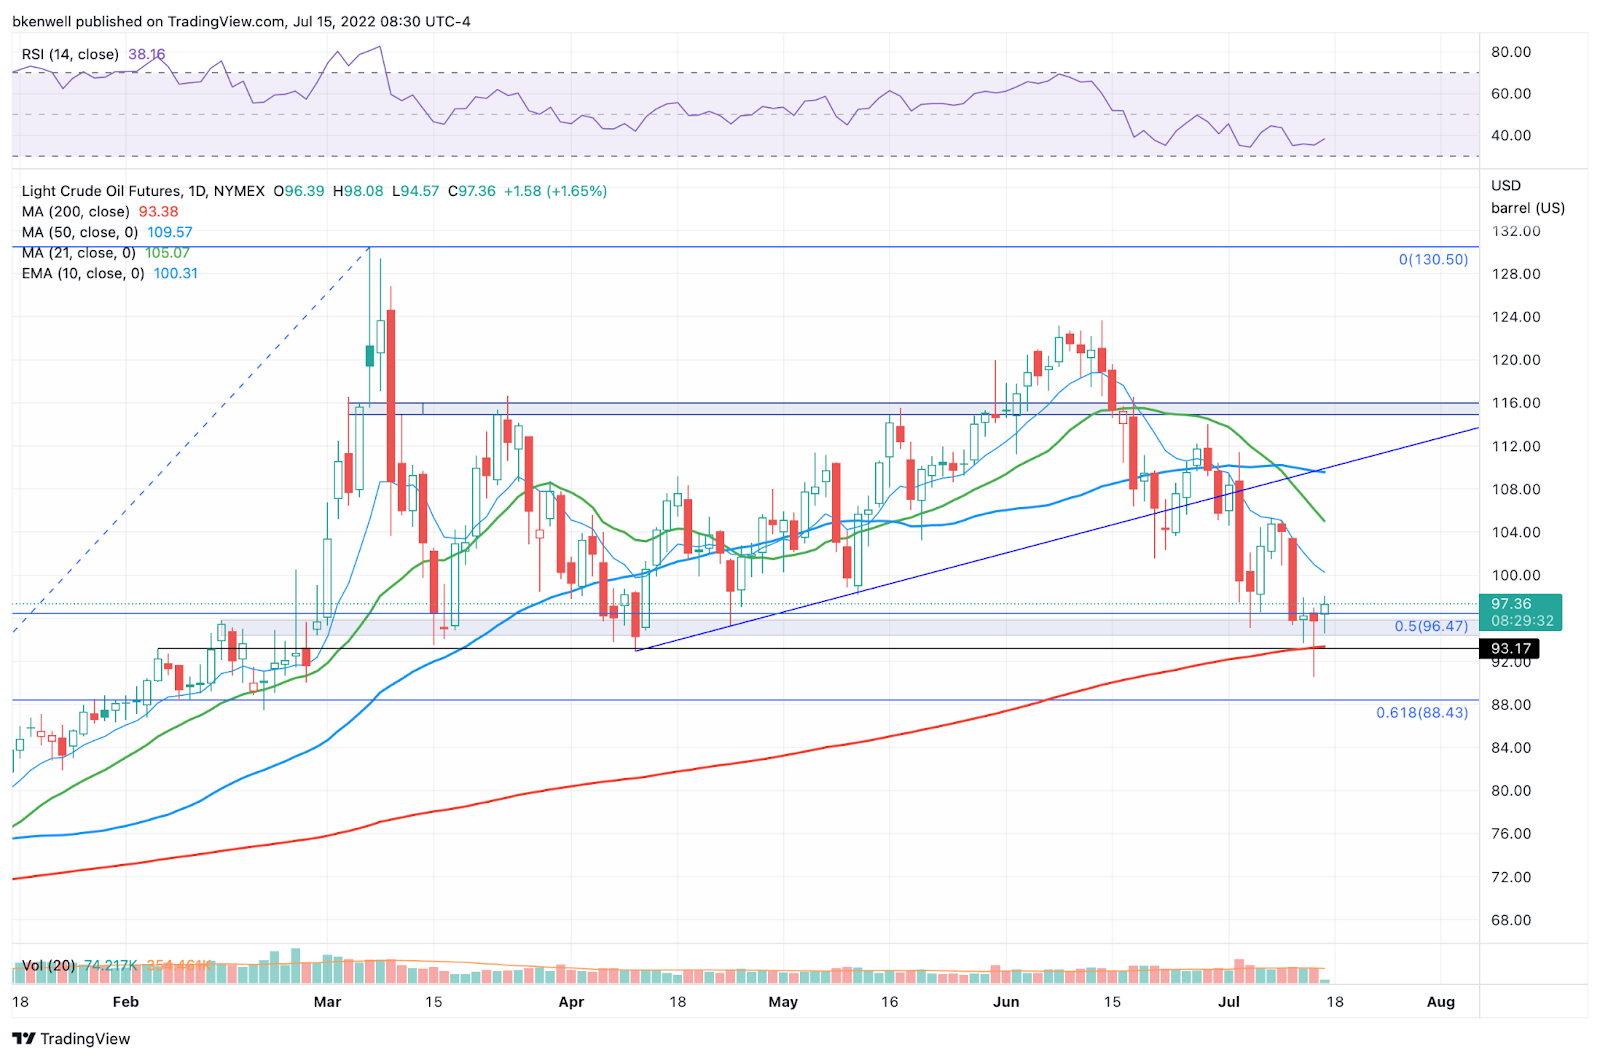
First target zone of $97 to $98 was hit. Now looking for $100 & the 10-day. I’m working against a break-even stop on this one now.
Go-To Watchlist — Individual Stocks
*Feel free to build your own trades off these relative strength leaders*
- Numbered are the ones I’m watching most closely.
- Bold are the trades with recent updates.
- Italics show means the trade is closed.
Trade Sheets: DLTR traded well yesterday.
- MCK — We have hit two trim zones so far on MCK. Feel free to cash the last ⅓ of the position as you see fit. $335 to $340 is a potential upside target if it continues higher. Moving stop-loss up to $315
- $335 hit on Monday, up to you on how to manage from here. I’m holding the last ⅓ against a profitable stop-loss.
- DG — Maybe this is the wrong move, but with DLTR also in our pocket, I am going to cash the remaining ⅓ position in DG at the open.
- MRK — Hit Targets 1 & 2 → Now out of ½
- $90 to $91 Stop Loss (or B/E).
- Looking for $95+ for ¼, then not sure. Maybe hold the last ¼ for a push to $100 if we don’t get stopped out. d
- DLTR — Long entry triggered. Hit our first price target yesterday ($167 to $168). Now looking for $169.50 to $170+ for our second trim.
- Stop-loss inched up to $162 or up to B/E. As always, your choice.
Relative strength leaders (List is cleaned up and shorter!) →
- DLTR
- MRK
- PEP
- ABBV
- UNH
- JNJ
- XLE
- CLR
- VRTX
- DG
- IBM
- MCK
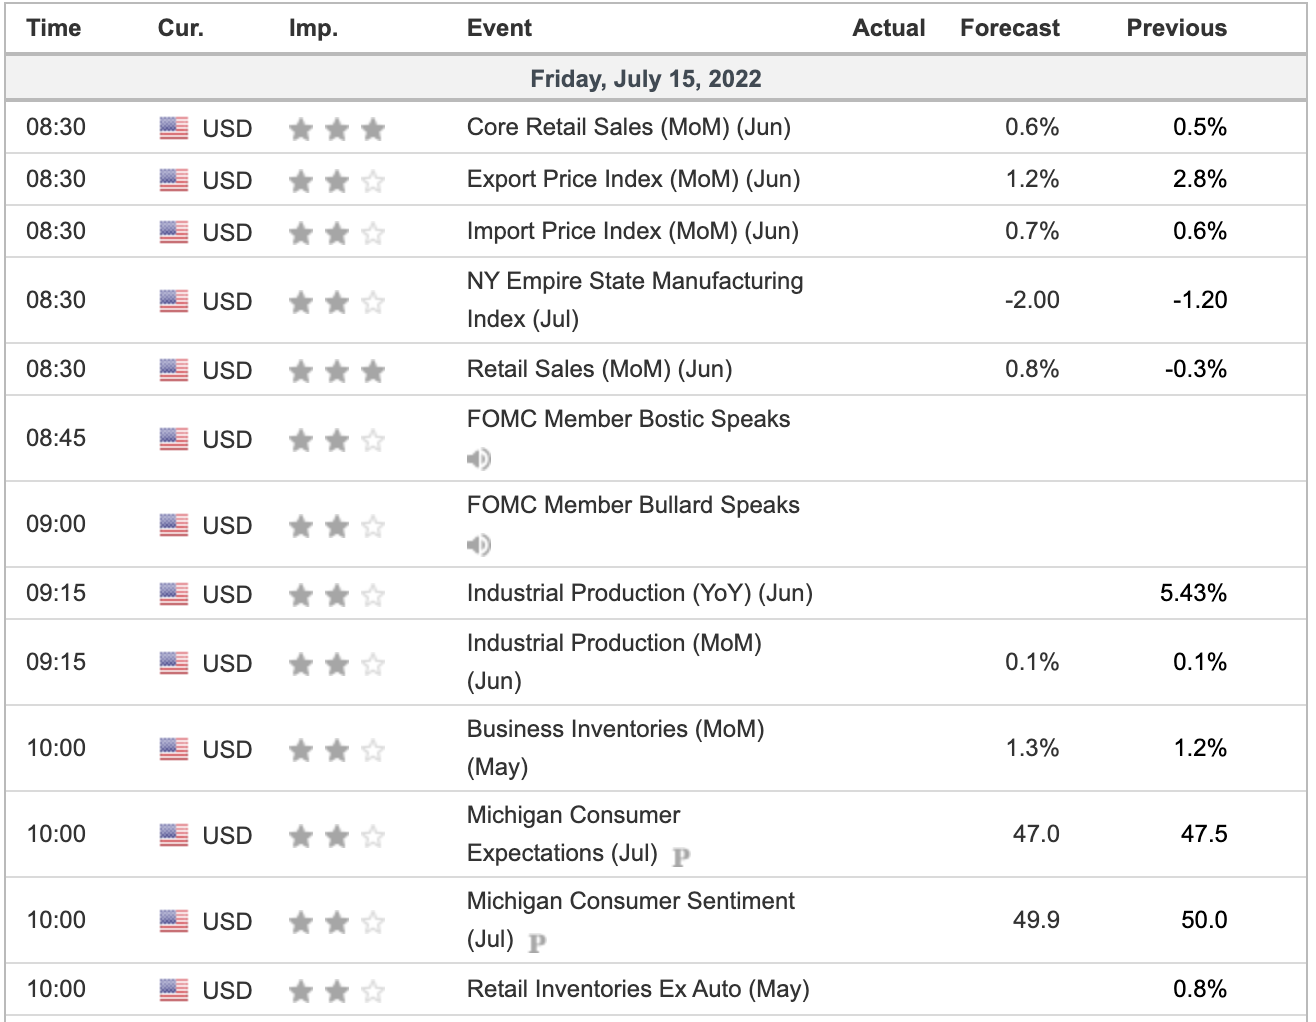
Economic Calendar
As we all know, there’s no crystal ball when it comes to trading stocks, options, or futures. But the Market Imbalance Meter may be as close as it comes. Knowing how the “Big Money” is placing its bets can give our trading room a big wave to ride — or a warning sign to stay out of the water. Come check it out now, risk-free for 30 days.
Comments are closed