GOOGL, MSFT, and META all disappoint.
Follow @MrTopStep and @BretKenwell on Twitter and please share if you find our work valuable.
Don’t Forget: The Long-term performance of the S&P 500, some longer-term setups, and 5 red flags that showed up before the 2022 bear market.
Our View
I’m going to be honest: I got spun around yesterday. It’s been a messy trade and yesterday was no exception. Today is T+2 and I think there is a mix of month-end buying and fiscal year-end, which should benefit the buyers. The ES worked through the MSFT and GOOGL earnings disappointments and tonight it’s Meta with a major disappointment, as the stock is down more than 20%.
Despite the weakness in tech, the ES has been back and filling at the 3820 to 3840 level. When you look at it like that — remember, 3820 had been resistance and now it’s support — it’s pretty impressive.
I am going to look for pullbacks to buy, but if I am wrong I am going to get out. November is the second-best month of the year for the Dow and S&P since 1950 dating back to 1971. It also starts the best three, six, and eight months for stocks.
This morning, we posted the third interview in this series with my good friend Rich Miller, who operates HandelStats and who I have known for more than 30 years from the S&P pit on the CME floor.
If you missed that interview, please take some time today or this week to give it a read here. Rich will also be conducting Our Lean today.
Our Lean with Rich Miller
The NQ needs an hourly close today back above 11,437.25. Above there and it should go right to 11498.25. That puts it in a position to test the 11,600 area and an hourly close above there puts the market in a position to test yesterday’s highs (11,703.50). A daily close above 11720.10 targets 12182.10. On the downside for the NQ, a daily close below 11,200 would be a negative.
The Naz is going to have to lead to get the Spooz to follow.
Speaking of the S&P, the ES needs an hourly close today above 3849.25, above there it should go right to 3861.50 to 3865.75. An hourly close above there targets yesterday’s highs. A daily close above 3873.95 targets 3922.95.
On the downside, a daily close below 3796 would be a negative.
If this afternoon’s earnings after the close do not take the market down, it should close on new highs for the week and go higher on Monday for the month-end.
Again, Rich’s work can be found here.
Daily Recap

The ES sold off down to 3831.50 on Globex and opened Wednesday’s regular session at 3837.25. After the open, the ES made its low at 3834.25 and then rallied up to 3852.75 before selling back down to a higher low at 3836 going into 10:00. It was that low that set up the push up to 3881 at 10:40.
After the pullback, the ES made a sequence of higher lows and higher highs that pushed the ES all the way up to 3897.50 at 11:43, up about 63 points from the regular-session low. After the NQ made its high, several sell imbalances showed up and then the ES sell program pushed the ES back down to 3848.50 at 1:33, down 49 points. The wide ranges continue.
After the low, the ES rallied 16.5 points back up to the 3865 level, then sold off 29 handles down to 3838.25 and upticked to 3851.75 at 3:41. The ES traded 3847 as the 3:50 cash imbalance showed $1.7 billion to buy and downticked to 3838.50 at 3:59 and traded 3844 on the 4:00 cash close.
In the end, the best way to describe yesterday’s trade is messy. In terms of the ES’s overall tone, it was similar to Tuesday’s trade, rally in the first part of the day and a pullback in the afternoon. In terms of the ES’s overall trade, 2.03 million contracts traded. High for normal times, but low in this environment (20-day average is 2.37 million).
Technical Edge
- NYSE Breadth: 62% Upside Volume
- Advance/Decline: 59% Advance
- VIX: ~$27.50
S&P 500 — ES
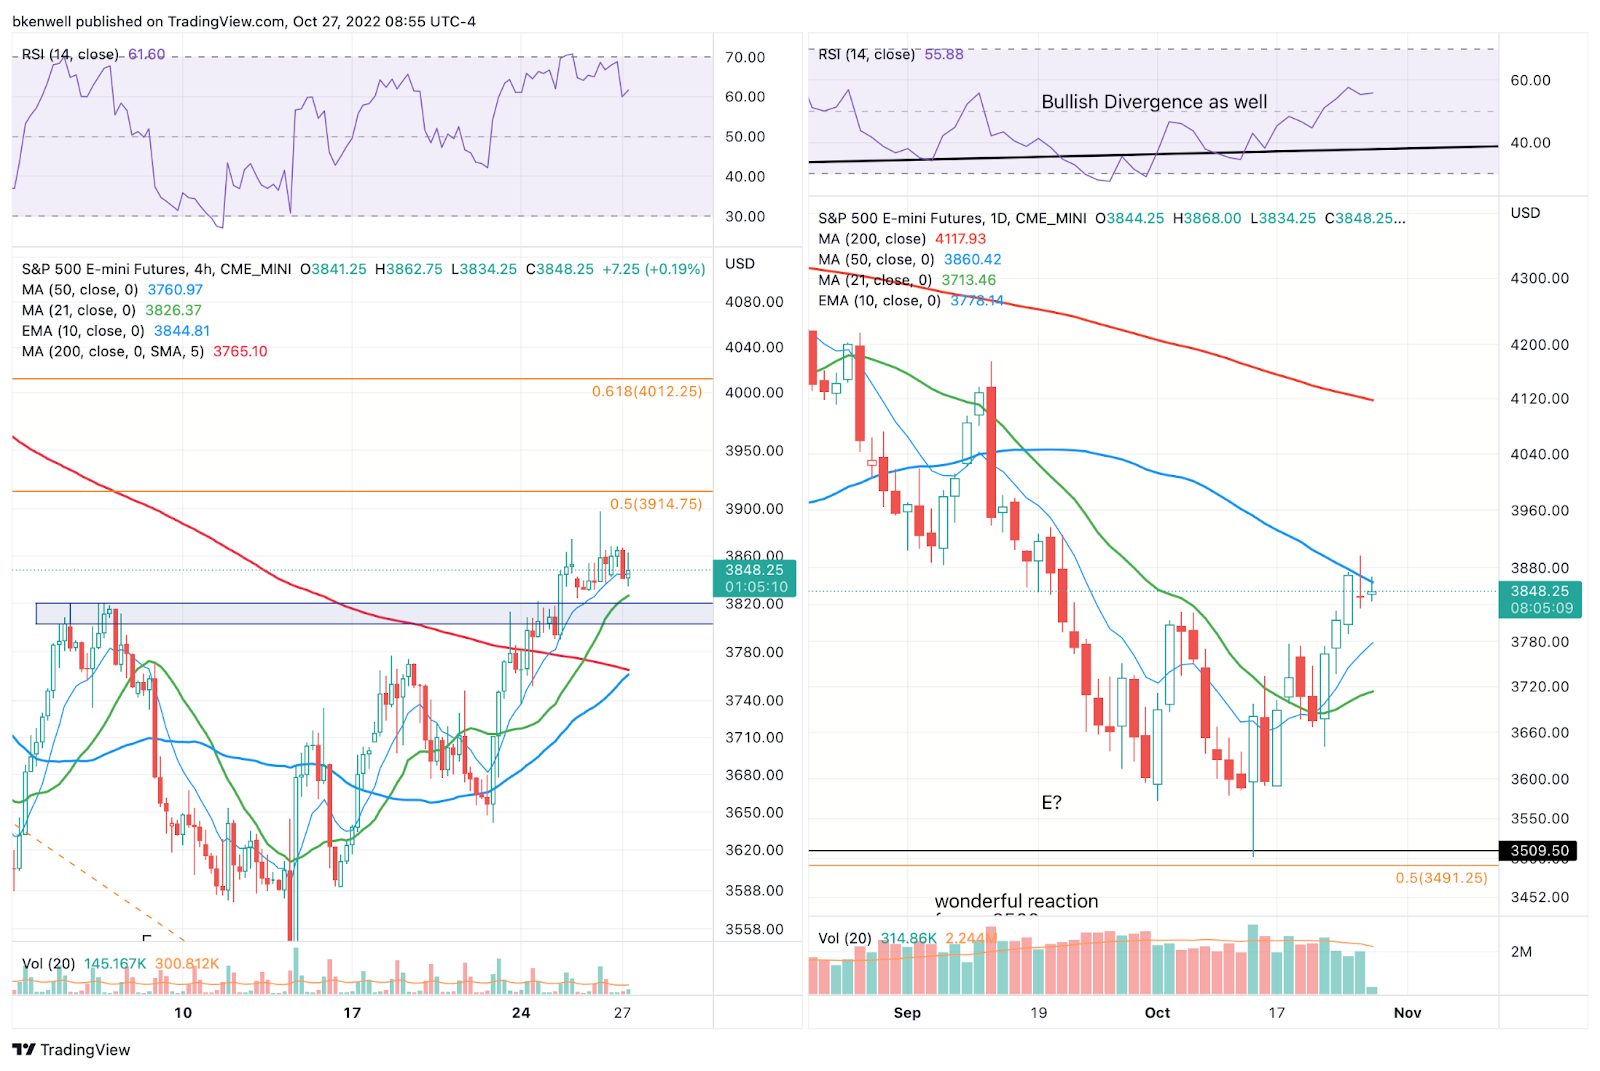
Above has the H4 chart on the left and the daily chart on the right, which highlights the 3800 to 3820 area as potential support and 3860 to 3870, which has been current resistance. The latter also has the declining 50-day moving average working as resistance.
On a dip, keep an eye on the 10-ema on the H4 chart, as well as the 3820-ish area for a possible bounce.
Failure here could put 3800 in play, followed by 3775.
Go-To Watchlist
*Feel free to build your own trades off these relative strength leaders*
- Numbered are the ones I’m watching most closely.
- Bold are the trades with recent updates.
- Italics show means the trade is closed.
Open Positions
- XLE — Trimmed into strength on Friday and now down to ⅓ position here (or lower). On the downside, use a B/E stop.
- You can either be out completely at $87.50 to $88 or leave a runner for $90+
- GIS — Technically went weekly-up, but did not close. Can consider a ½ position against a stop at $76.
- Let’s see if the DXY/UUP — the dollar — can find its footing in this key support area.
Relative strength leaders →
Top (absolutely gorgeous moves lately):
- LNG
- MCK
- CAH
- CI
- CCRN
- GIS — watching the weekly-up setup from Tuesday.
- LPLA
- REGN
- ALB
- VRTX
- UNH
Economic Calendar

Comments are closed