Our View
I was humbled twice yesterday. Once by the results of the Opening Print poll Bret sent out and once by the markets.
In the nearly 30 years of writing the OP, I never thought I would get such great feedback — THANK YOU! — and I promise to work on everything we can to make some of the improvements that were suggested. It’s not easy to write something interesting everyday and I don’t want it to be like the other newsletters.
Yesterday’s other lesson was from the market. I went in with a plan to not buy the weakness and to be patient and sell the rally. I am a big believer in owning my trades, but I was on the phone with the PitBull when the ES was breaking down and I got short into the decline. I broke two of my rules, the cardinal rules that I use everyday:
- I was over trading, and
- I didn’t use stops.
I made a few small winning long trades late, but it was small change compared to what I lost. I have always thought that the markets will allow you to lose as much as you allow it, that’s why I get in and out so quickly most of the time.
That said, I have had a lot of good luck in 2022 and now I just have to work harder and trade smarter to get the recent losses back.
Our Lean
I think the lower volumes are playing tricks on both the longs and the shorts. While the lower volumes do favor the upside, that doesn’t mean this isn’t a two-way street.
At some point the selloffs will exhaust and so will the rips. Is the ES finally targeting 4550 or 4600? It looks that way, but weak bond markets do not favor technology and that’s not going to change. I want you to keep bonds up on your screen, just to have a feel for how they are trading.
Sell the early rallies and buy the pullbacks for today.
CPI Data on Tap
There are a few key elements that factor into the stock market and the bond market is a major one. We all know when bonds rally, interest rates fall. When the bond market falls (and rates rise), it signals higher borrowing costs.
We see it every day, from the gas that you put in your car to going to the grocery store, prices are not just going up…they are skyrocketing. We don’t need Goldman to tell us there will be five rate hikes in 2022. The Fed is way behind the eight ball right now and its balance sheet is swelling to over $9.5 trillion.
When the Fed increases or decreases the assets and liabilities on its balance sheet, it can ultimately have a significant impact on all consumers and businesses and at current levels, it will be next to impossible to pay back — especially when rates are going up.

Tomorrow, we will get the January CPI data at 8:30 A.M. ET.
Strong CPI data could boost Fed rate-hike expectations and hurt bonds — thus hurting stocks and in particular, tech.
According to Morgan Stanley, U.S. inflation data on Thursday may be key to whether the bond rout that has sent benchmark Treasury yields to two-year highs is likely to continue, with investors likely to price in more aggressive rate hikes if the number comes in stronger than expected.
“An upside surprise next Thursday would mean further talk of the Fed raising rates 50bp in March. At a minimum, calls for the Fed to hike at every meeting this year will look much less off-base,” Morgan Stanley analysts said in a report.
The CPI data is expected to show that prices rose 0.5% in January, and are up 7.3% on the year, according to the median estimate of economists polled by Reuters.
Either way, this will be a market-moving economic release.
Daily Recap
The ES opened Tuesday’s regular trading session at 4471, down about 15 points from Monday’s settlement. After making an early high of 4479, the ES pulled back and broke below Monday’s low of 4662.75 and bottomed at 4556.25 just after 10:00.
That low set up a 55-point rally up to 4517.25 at 12:45, before the ES sold back off down to 4485.50 at 3:05. From there, it rallied to a new session high at 4523.75, which came as the 3:50 cash imbalance flipped from about $400 million to sell to $724 million to buy.
The ES traded ~4513 on the 4:00 cash close and settled at 4518.25, up 34.50 points or 0.77% on the day.
In the End
In the end, it was another great example of what happens when volume drops — “thin to win.”
In terms of the ES’s overall tone, it shrugged off the weakness in the bond market and rallied. In terms of the ES’s overall trade, volume was low at 1.42 million contracts traded. The 20-day average volume is still north of 2 million, for what it’s worth.
As we all know, there’s no crystal ball when it comes to trading stocks, options, or futures. But the Market Imbalance Meter may be as close as it comes. Knowing how the “Big Money” is placing its bets can give our trading room a big wave to ride — or a warning sign to stay out of the water. Come check it out now, risk-free for 30 days.
Technical Edge
- NYSE Breadth: 65% Upside Volume
- NASDAQ Breadth: 68.7% Upside Volume
After yesterday’s gains, we’re looking at more follow-through this morning. That’s great, because I have been really torn on the price action lately.
Specifically, looking at the SPX and Nasdaq charts, one could make a case in either direction.
Yesterday we talked about needing some leadership from the big tech companies and how the market was building on some positives:
“On the upside, we do have a higher low to work in all of the major U.S. indices. Cryptocurrencies are trading incredibly well and even ARKK held up okay yesterday. We’re not waving the green flag necessarily, but there are positives to start building on.”
Game Plan
Those are positives. But the market also had this look to it — a bear pennant — that could have made a downside break just as likely. I don’t think there’s anything wrong with saying “I don’t know what the market will do” and in this case, we really didn’t.
The pattern could have gone both ways and sometimes that’s just the way it is.
Now we see if the market can keep today’s gains. Tomorrow’s CPI report will be key as well.
S&P 500 — ES Futures
- Feel free to extrapolate this layout to the SPY.
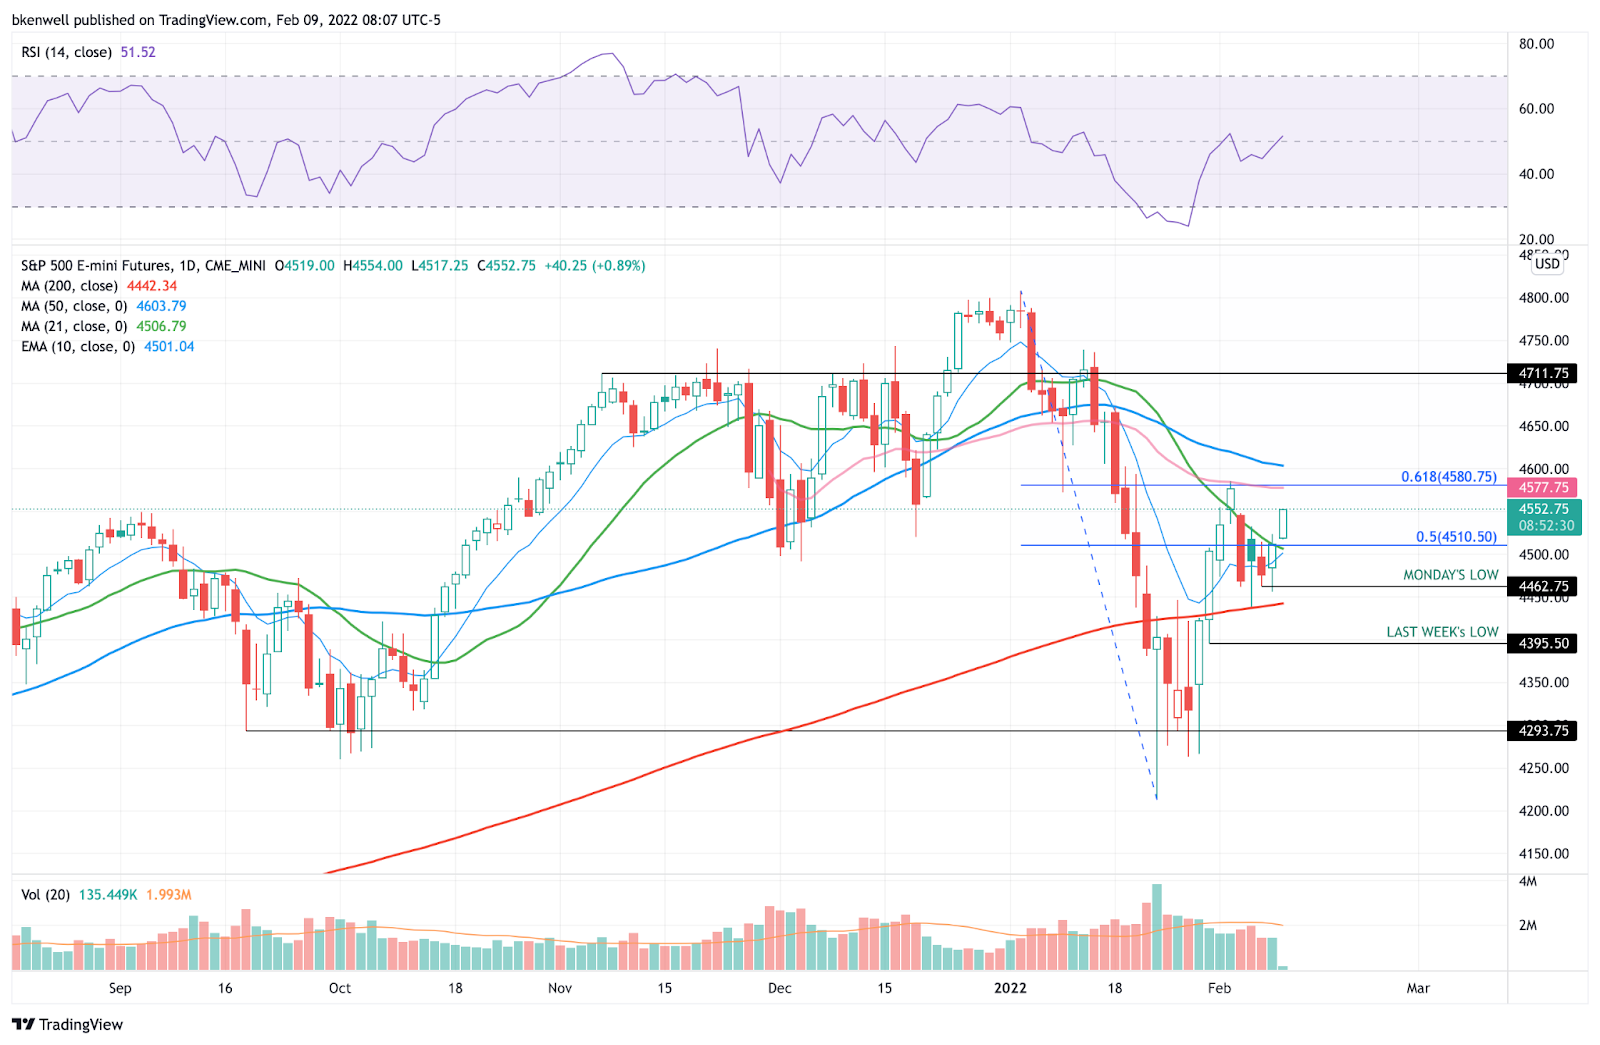
“On the upside, we have been writing about 4510 for a few days now. That’s the level to clear and hold.”
Yesterday we cracked the prior day’s low, then reversed and took out 4510. Firmly above the declining 21-day during Globex, let’s see if the ES can rally to the 4580 to 4586 area. That’s the 61.8% retracement of the current range, last week’s high, and the daily VWAP.
Above that could give us a test of the 50-day moving average near 4600.
If we fade, I would love to see the ES hold 4510. Below 4500 and this can get a bit ugly again.
Nasdaq — NQ Futures
- Feel free to extrapolate this layout to the QQQ, roughly speaking.

Let’s see how it handles the 200-day and 15K level. Above it opens the door to the 15,240 to 15,260 area, which is the 50% retracement of the range and last week’s high.
From here, I want to see a close above the 21-day.
Individual Stocks & Go-To Watchlist — AAPL, AMD, Energy
AAPL
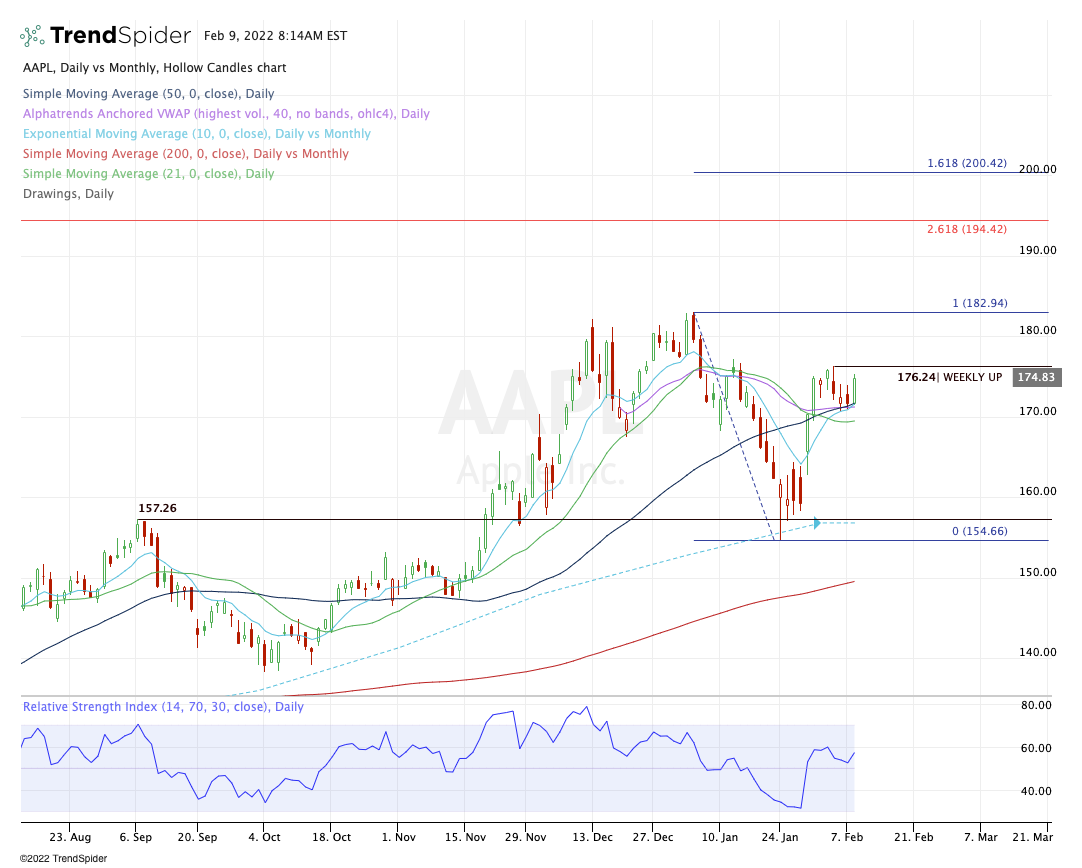
Beautiful move off the 10-day and 50-day moving averages, as well as the daily VWAP yesterday. Apple gave us exactly the move we were looking for, with a 2x daily-up rotation.
Now up about 1% in the pre-market this morning, it will try to go weekly-up over $176.25.
This always leaves me a bit torn: Book profits on the short-term pop or stay long for a potentially larger move?
I personally favor booking ¼ to ⅓ of the position here and moving to a break-even stop-loss. I don’t want the market to take my gains back, but I want to keep a decent position on in case we can push $180 or so.
AMD

This is why we do these individual stock write-ups. AMD was on the radar from Monday, couldn’t hold the rotation into the close, but burst higher on Tuesday.
Like Apple, I would trim slightly here, ⅓ at the weekly-up and post-earnings high near $130 (and move to a break-even stop).
More aggressive traders can go for the 50% retracement near $132. In either scenario, my next trim spot would be the 50-day moving average and the daily VWAP.
Energy
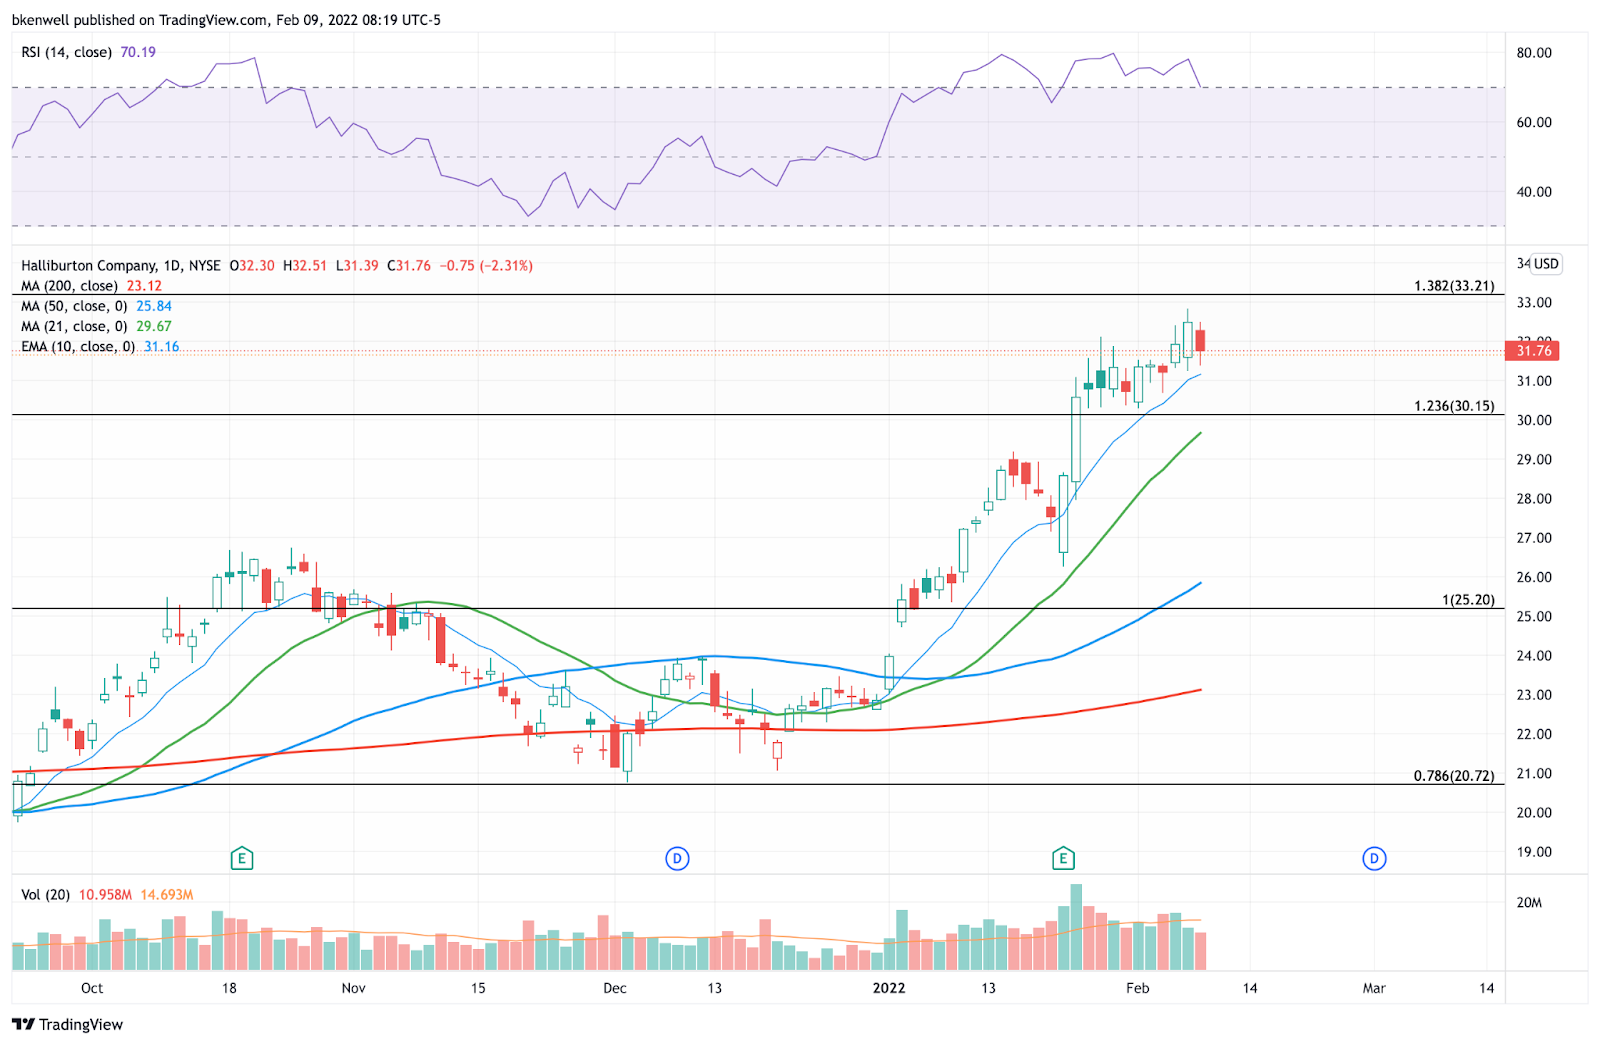
Above is Halliburton, but the chart can be extrapolated to a number of energy stocks (like the ones listed below).
Oil is trying to find its footing here near the 10-day, as are many of these stocks. I will be watching them closely today if HAL, OXY, XOM and others can undercut Tuesday’s low and bounce from the 10-day, giving us a bullish reversal.
The goal is to get a great R/R setup on the stocks and put us in a position to push them higher.
If they can’t reverse, they may need more time.
Go-To List —
Feel free to build your own trades off these relative strength leaders
So much of this list continues to trade really well. Quite please with the developments here.
- UPS
- BAC, WFC and other banks are trading well. These 2 are trying for monthly-up rotations. | ASB, MET, MS
- VRTX — strong move last week.
- Energy — led by HAL, XOM, OXY & many others. (Oil dipping this a.m.) so keep an eye on this group. Crude at the 10-day moving average.
- AAPL — back on the go-to list.
- ABBV — Continues to do well. 261.8% extension is $147-ish
- CVS
- DE
- BRK.B
- TD — continues to perform incredibly well.
- V & MA — Resetting nicely. See if a bid comes in soon
- BROS
Economic Outlook
The Big CPI report is due up Thursday, FWIW.

As we all know, there’s no crystal ball when it comes to trading stocks, options, or futures. But the Market Imbalance Meter may be as close as it comes. Knowing how the “Big Money” is placing its bets can give our trading room a big wave to ride — or a warning sign to stay out of the water. Come check it out now, risk-free for 30 days.
Disclaimer: Charts and analyses are for discussion and education purposes only. I am not a financial advisor, do not give financial advice and am not recommending the buying or selling of any security.
Remember: Not all setups will trigger. Not all setups will be profitable. Not all setups should be taken. These are simply the setups that I have put together for years on my own and what I watch as part of my own “game plan” coming into each day. Good luck
Comments are closed