Here’s our approach to the Fed.
Follow @MrTopStep and @BretKenwell on Twitter and please share if you find our work valuable.
Don’t Forget: The Long-term performance of the S&P 500, some longer-term setups, and 5 red flags that showed up before the 2022 bear market.
Our View
Yesterday was a big fat mess. The ES traded 3924.25 at last Friday’s highs and traded 3924.25 as the high during yesterday’s day session. As I have always said, I’m not here to fight city hall. If the ES is going up I want to go for the ride, but getting bullish after the ES has rallied over 400 points off its recent low is hard.
I guess the question is, do the markets hold together into the midterms, then start going back down? It’s possible — but they have to get through the Fed first, which will have two more rate hikes this year, including one today.
The Fed’s rapid rate hikes have beaten up the stock market for much of the year. I don’t see how the S&P can just keep going up in light of all the negative headlines and weakness in mega-cap tech stocks. Sure the Dow has rallied over 4200 points from its October low, but that fits the historical trends. It’s worth pointing out that the Dow has been the best-performing US Index off the recent low.
Let’s face it: The markets are making good of the bad news and that’s not going to stop. The PitBull and I talked about yesterday’s price action and he mentioned the “headline news algo” and how they are constantly moving the ES up and down like a yoyo and I told him that the algos own the markets. Run ‘em up and run ‘em down.
Our Lean — Danny’s Take
Ed Seykota from the Market Wizards book always said that you trade up to the event, not the event — but that is not how I am going to play it. My lean is to wait until the Powell headlines hit the tape. I’m not going to get caught in the “shake & bake.”
Every rate hike has eventually been followed by a drop so far this year…what makes today different? And let’s not forget, the last CPI report on Oct. 13 was hot across the board. I’m not making any prediction necessarily, I’m just trying to stay level-headed here.
There is no question: They will run the stops on both sides once the news hits the wire.
However, what traders really want to know is, what is the Fed’s intention going forward? If Powell gives us a Jackson Hole repeat, the markets will be pinned to the wall. If the Fed tips its hand that it wants to ease up on the rate hikes — AKA a mild pivot — the bulls may just rejoice.
Daily Recap

The ES opened Tuesday’s regular session at 3922, traded up 3924.25, and then puked more than 70 points down to a regular-session low of 3852.50.
The good news? This was the low for the day. The bad news? The ES never really recovered from the day’s big fade. The ES did rally 28 points up to 3880.25 at 12:06, but then it sold off 21 points and ended up chopping around in a large back-and-fill pattern between 3860 and 3880. They bought the 10 to 20-point dips and solid the 10 to 15-point rips.
The ES traded 3874 as the 3:50 cash imbalance showed $2.47 billion to buy. On the 4:00 cash close, the ES traded 3865 and after 4:00, the ES settled at 3861.75 on the 5:00 futures close, down 17 points or 0.44% on the day.
In the end, all the buying power was used up and the JOLTs number spooked the indices, which gave the Fed more ammo to raise rates. In terms of the ES’s overall tone, it was a sea of tech sell programs. In terms of the ES’s overall trade, volume was steady at 1.83 million contracts (but was again below the 20-day average for the 7th straight session).
Technical Edge
- NYSE Breadth: 67% Upside Volume
- Advance/Decline: 59% Advance
- VIX: ~$25.75
Today is FOMC and we are coming into the day in a good position. On Monday, we booked 25 to 30 points in profit on the S&P futures, then hit the fade trade on Tuesday. Ultimately, I covered Tuesday’s short too early, as upside breadth was stubbornly strong and that made me think I shouldn’t overstay my welcome.
A couple of early wins allow us quite a bit of patience to let the news play out today. At 2 pm, the algos are going to go wild. Remember, they like to run the stops on both ends before finding some balance and picking a direction.
Perhaps more than any other FOMC statement, the markets will want to hear what Powell has to say. Let’s coast into the session, not rush to do anything aggressive, stay disciplined and see what the Fed is up to.
Powell has the power to continue the recent rally or stop it in its tracks. I’m not looking to guess which one it is ahead of the event. I’d rather react to it than try to predict it.
S&P 500 — ES
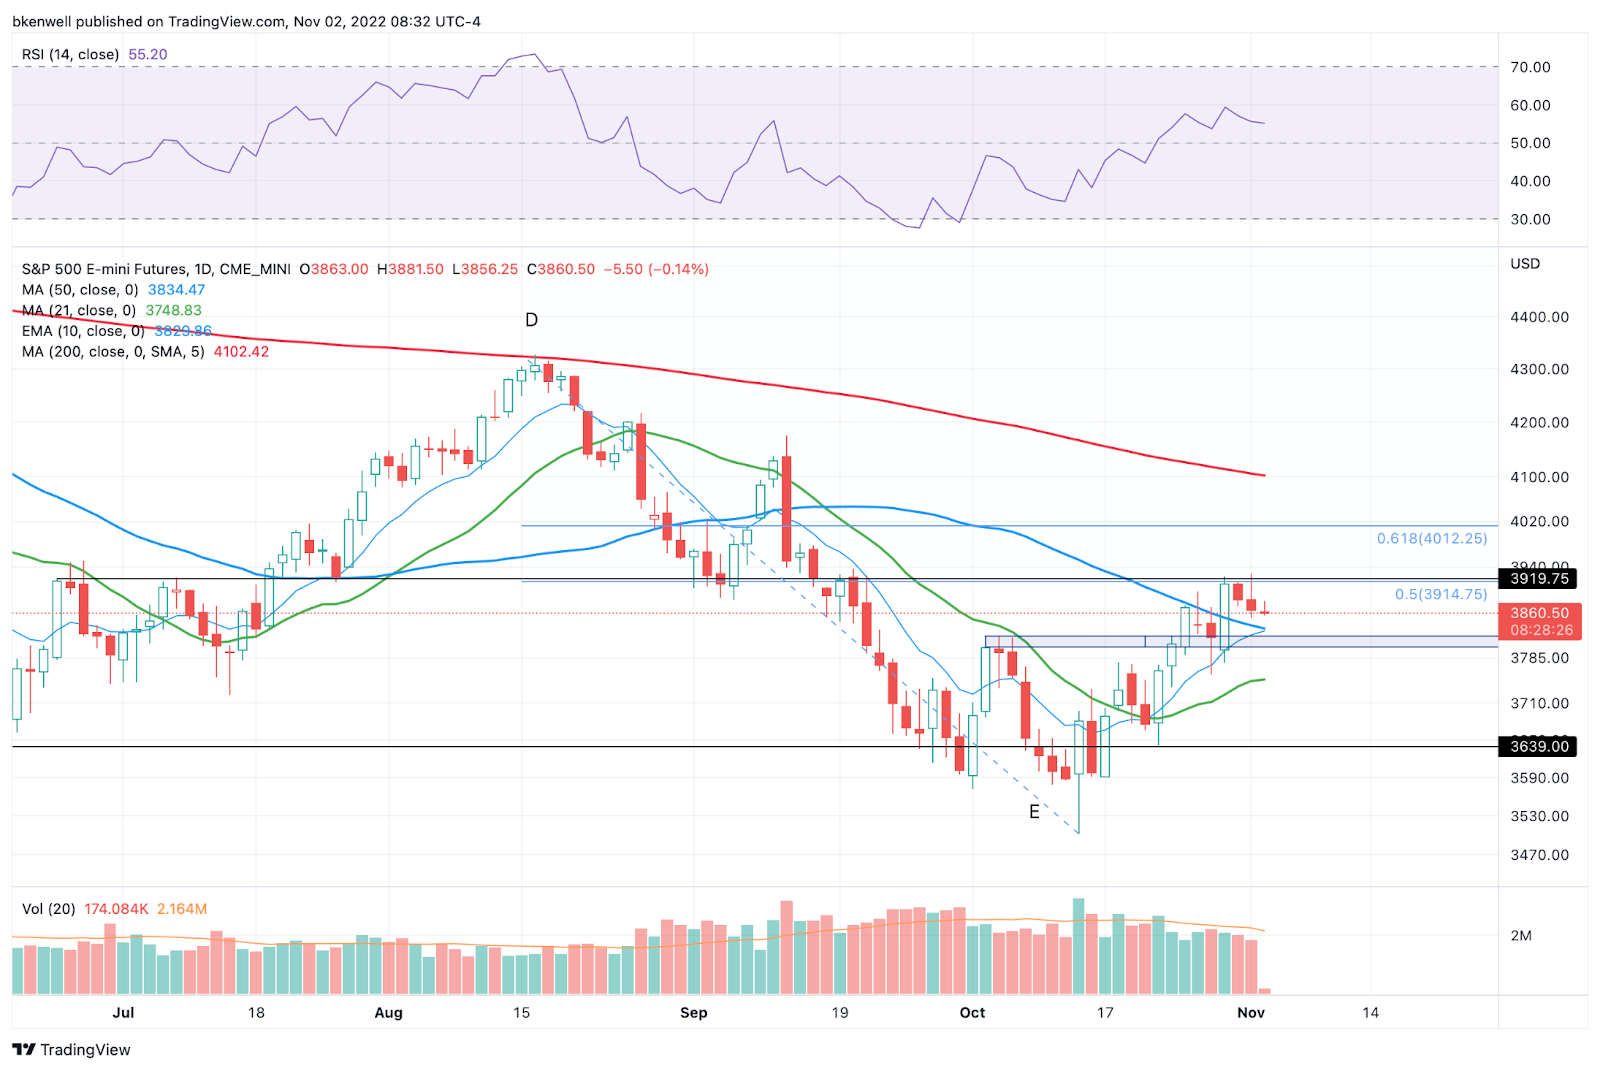
I like how the S&P has cooled off the last two days. We’re under a little more pressure today as the ADP number came in better than expected.
Honestly, if the Fed says what investors want to hear, this two-day dip may give it enough ammo to push higher. If that’s the case, 3920 to 3925 is the first upside target, then 4000 to 4015.
On the downside, I’m watching 3835, which is where the 10-day and 50-day moving averages come into play, followed by the 3800 to 3820 zone, which is prior resistance turned support.
But at the end of the day, all of this hinges on the Fed. If they are net-net becoming less hawkish, markets have room to run. If Powell stonewalls the market, sub-3700 could be back on the table eventually.
SPY

As for the SPY, we have a bearish engulfing candle from yesterday, but it hardly matters. The “event” will decide its fate from here.
Above $390 opens the door to $400 and the 61.8% retracement, then conveniently, $410.
On the downside, $380 is key support. If it fails, $365 to $370 could be on deck. A break of $365 and $350 is vulnerable.
QQQ

Big tech is keeping the QQQ from leading the current market rally. In fact, it’s still struggling with resistance and really just looks like a bear-flag pattern at the moment.
Bulls need a decisive move above the $280 to $284 zone and the 50-day moving average.
Bears will look for a break of the $266 to $270 zone, which includes recent support, as well as the 50% and 61.8% retracements.
Go-To Watchlist
*Feel free to build your own trades off these relative strength leaders*
- Numbered are the ones I’m watching most closely.
- Bold are the trades with recent updates.
- Italics show means the trade is closed.
Open Positions
- GIS — Down to ⅔ at least, but ½ position here is now okay. B/E stop. Next trim is $82.50 to $83, then $85 to $86.
- UUP — should trim at least ⅓ on this morning’s gap-up open if you have not yet trimmed. Carrying a ⅔ to ½ position if we hit $30 is reasonable.
- Nice bounce from our entry but short-term overhead hurdles exist (10-day & 21-day, plus the gap-fill at $30.07).
Relative strength leaders → So many stocks need a reset back to short-term support (10-day ema) →
Top Picks (these have been Robust lately):
- LNG
- MCK
- CAH
- CI
- CCRN
- GIS — Weekly-up
- LPLA
- REGN
- ENPH — it’s back on the list.
- VRTX
- UNH
- MRK, AMGN
- XLE — XOM, CVX, COP, BP, EOG, PXD
- TJX
- NOC
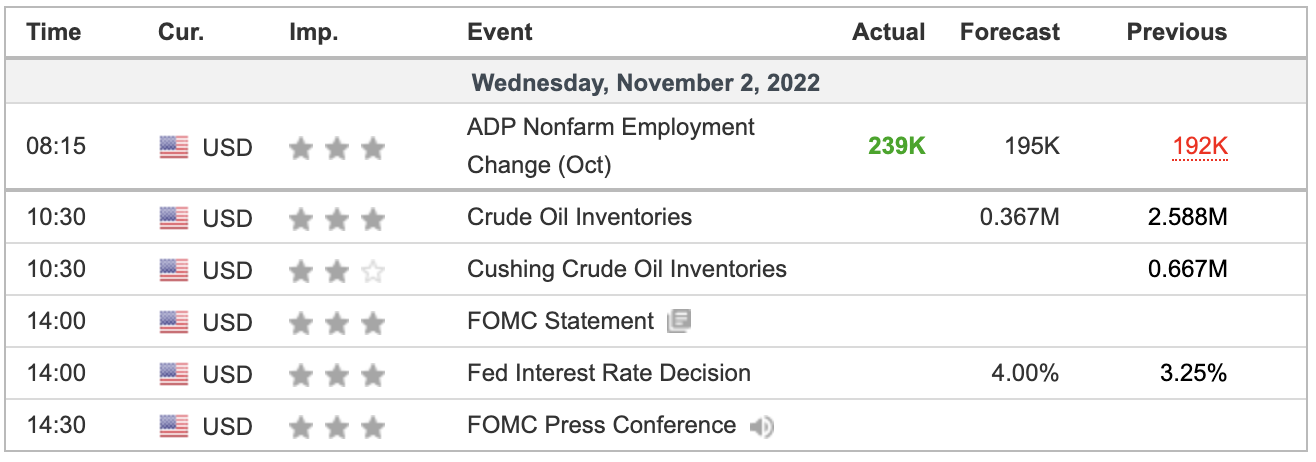
Economic Calendar
Comments are closed