Our View
At this stage in the game, all I can say is I’m not surprised at all by yesterday’s CPI RIP. As I said yesterday, the ES has been in a big back-and-fill pattern and every drop was being bought. This is the way it’s been for the past 6 weeks and I still think the trend is up. The big question now is: How far can it go?
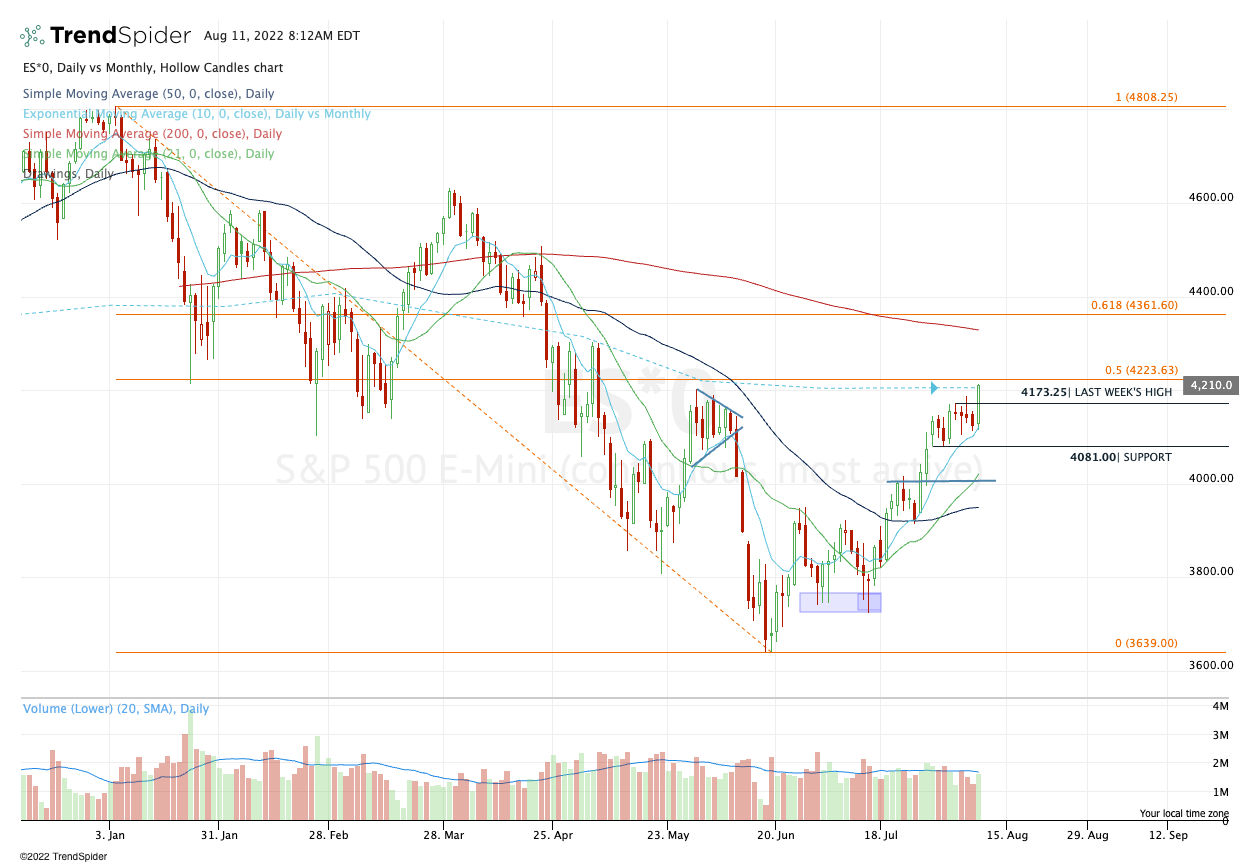
Well, it’s a question asked by many, but I still see the 50% retracement at 4223 being in play. I’ll put the rest of the levels in the Lean.
That said, I’m not going to change my tune — I am a cautious bull.
I know people think the softer CPI number could lead the Fed to moderate the pace of its rate increases, but I doubt a 0.2% drop in inflation to 8.5% is going to change the status quo (even though it did produce a pretty robust rally). While everyone tends to look at the Dow, S&P, and Nasdaq, the Russell 2000 gained 2.95% on Wednesday. That was well above the S&P’s 2.1% gain (and shows further “risk-on” appetite).
So what does it all mean? It’s pretty easy to see money is flowing back into stocks and yesterday’s $1.4 billion to buy on the imbalance is just one example. In fact, when you look at the last 6 weeks of MOCs/imbalances, the buy imbalances have dramatically outweighed the sell imbalances. I have always said if you want to know where the S&P is going, follow the money and that is exactly what the MIM does.
Since July 1, there have been 20 MIM buys vs 8 MIM sells for a net buy of $20 billion.
*** Lastly, the long-awaited MrTopStep trading webinar is scheduled for mid-September (we are thinking 9/10). We are going to pull out all the stops. I’ll provide more info in the weeks ahead.
Our Lean
The ES has been choppy over the prior few days but is working on its fourth straight weekly rally and fifth weekly rally in the last six weeks. Further, it’s up almost 600 points from its contract low and is now within spitting distance of the 50% retracement.
I think the ES can go higher (tons of buy stops), but I also think it would not be impossible to see a few sideways to down days. On the upside, I’m still closely watching the 4223 level — which is the aforementioned 50% retrace — followed by 4250 and 4300.
On the downside, the levels on my charts include 4195-93, 4185, 4178, 4147-4142, and 4130.
Remember, there are three parts to the trading session: What happens on Globex, what happens after the 9:30 open, and what happens in the final hour.
Between PitBull and I, he won with Tuesday’s dip, but I won with yesterday’s rip 🙂
Daily Recap
Here’s a short and sweet recap. The ES traded 4138.50 at 8:30, up 13.50 points from the 4:00 close on Tuesday as it went into the CPI report. From there, it exploded 63 points in a matter of minutes, hitting a high of 4201.50, and opened Wednesday’s session at 4199 at 9:30.
4200 was initially resistance and after the ES drifted down to 4178.50 shortly after 10:15, it found support, bounced, and traded 4212 about an hour later. From there, it drifted sideways until the afternoon where it gave bulls another dip down to 4195 that was bought and traded 4210.50 at the 4:00 close.
In the end, it was a strong, bullish up-move on the CPI report. In terms of the ES’s overall tone, breadth was robust. In terms of the overall trade, volume was solid at 1.55 million contracts
- Daily Range: 99.75 points
- H: 4213.50
- L: 4113.75
Technical Edge
- NYSE Breadth: 92% Upside Volume (!!)
- NASDAQ Breadth: 85% Upside Volume (!)
- VIX: ~$19.75 (first time sub-$20 since April)
Yesterday we wrote:
***In-line or below expectations on today’s report gives the market the opportunity to continue its upside move. Above-consensus results increase the odds we pull back from here.***
Remember, it is the reaction to the report we are looking for, not for the report itself. We are traders, not economists.
We’re seeing how that panned out now, as the indices rocketed higher on Wednesday. The “reaction” to the “bad news” has been different lately than it was in the first half. FAANG was missing earnings and/or revenue estimates, yet rallying on the results. The Fed hikes by 75 basis points and we rallied again.
Those are the “change-in-tune” developments bulls have needed to see and the reaction yesterday was the latest example. Now though, they need to maintain momentum.
Game Plan: ES Futures, SPY, QQQ, NQ Futures, IWM
Individual stock setups to come later today.
S&P 500 — ES
“Bulls need a sustained move above 4170 to 4175.” Well, they got it!
Traders can boil it down as simply as they want: Above the 4170 to 4175 zone and they can be bullish.
It “feels” like we’ve had a huge rally and from the lows, we have. But look at the daily chart above. The ES has quietly declined in 6 of the prior 7 sessions before Wednesday’s rip.
That said, keep the ~4223 level on your radar. In tandem with the 10-month moving average, this area is one to note. However, if we can push through it, the 200-day moving average and 61.8% retrace could be in play another 100+ handles above current levels.

On the intraday, 4210 to 4215 is of interest to me — yesterday’s high and overnight support.
S&P 500 — SPY

Like the ES, the SPY faces a tough potential hurdle here with the 50% retracement and the 10-month moving average in its way.
But if traders want to approach this simply, they could say “bullish above $416.50.”
That’s a very clean shelf and with the SPY above this level, it’s hard for me to be bullish. Cautious? Sure. Bearish? Not right now. Over $421 and this could have legs into the $430s.
Nasdaq — QQQ

The Nasdaq isn’t quite as clean as the S&P.
Yesterday though, the QQQ went weekly up over $324.72. That could open the door to the $330s, with $332.50 being a reasonable upside target on this sequence.
However, if we go back below $324.72, we may want to be a bit cautious.
Nasdaq — NQ

We flagged support on the 10-day and boy did it work like a charm. Now though, the NQ is trying to push through the 13,385 level and go weekly up.
If we so, I’m watching 13,500, then 13,650.
On the downside, if the NQ is below 13,385 I may be “hands off.” — Not bearish, just neutral and waiting for a deeper dip or renewed momentum to the upside.
Russell 2000 — IWM

The Russell was the strongest performer yesterday, and look at how steep the recent trend has been.
Above $191 is bullish. I’m a buyer on a dip to this level, particularly if it lines up with the 10-day ema.
On the upside, I’m watching $200 to $204, followed by $210 to $213.
Go-To Watchlist — Individual Stocks
*Feel free to build your own trades off these relative strength leaders*
- Numbered are the ones I’m watching most closely.
- Bold are the trades with recent updates.
- Italics show means the trade is closed.
Trade Sheets: Now have 2-3 live trades, all with breakeven or better stop-losses. Great stress-free position to be in as we try to squeeze a bit more of upside out of this move.
- PEP — We got out Target No. 2 at $177. Either all out now or down to ⅓ of a position if playing for a breakout. Stop at $172 (above B/E).
- UUP — $28.60 to $28.80 is ideal trim zone, but bulls can trim ¼ at $28.50-ish if they’d like, as the UUP runs into the 10-day ema.
- Wednesday’s low, $27.95 stop-loss.
- CHNG — Trimmed a little over ⅓ of position into our first target of ~$24.50. Inching stop-loss up to $23.50.
- Next target: $25 to $25.30
- O — For anyone in it, $74 target hit, B/E stop. $75+ is next area for trim.
Relative strength leaders (List is cleaned up and shorter!) →
- CNC
- HRB
- ENPH — kickstarted the rally in Solar
- TAN
- FSLR
- LNG
- PWR
- CHNG
- COST
- PEP — trade is live
- BA
- UNH
- XLE
- MCK — trade is closed
Economic Calendar

As we all know, there’s no crystal ball when it comes to trading stocks, options, or futures. But the Market Imbalance Meter may be as close as it comes. Knowing how the “Big Money” is placing its bets can give our trading room a big wave to ride — or a warning sign to stay out of the water. Come check it out now, risk-free for 30 days.
Comments are closed