The markets don’t sleep or wait…for anyone.
Follow @MrTopStep and @BretKenwell on Twitter and please share if you find our work valuable.
Don’t Forget: The Long-term performance of the S&P 500, some longer-term setups, and 5 red flags that showed up before the 2022 bear market.
Our View
I can talk about levels just like anyone else, lay out a monthly chart and count all the highs and lows. When I did the UBS S&P index program trading business it only made up 20% to 30% of the daily volume. Today, algorithmic and high-frequency trading programs make up 90%.
I am sure some people did very well yesterday, but as I warned, this is not the time to try and get “even.”
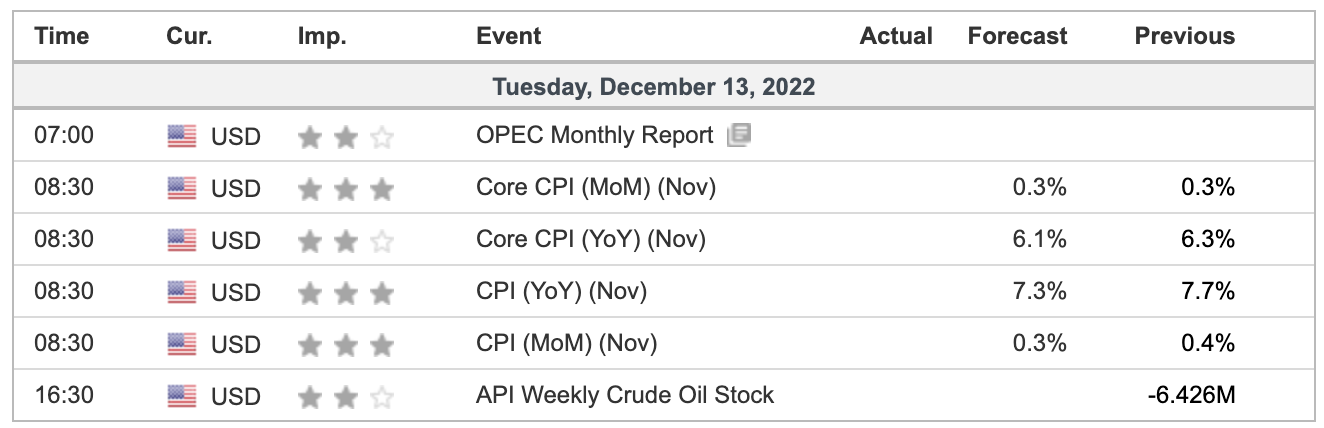
Today is going to be another overload. There are a couple of earnings reports and econ numbers, but the main focus is going to be the Fed’s FOMC rate decision and follow-up commentary from Chairman Powell.
On Friday, we have more than $3 trillion in options expirations, while futures continue to roll.
Yesterday I put this on Twitter before the open:
IMPRO: Dboy :(8:27:38 AM): Its take your shot time
Then
IMPRO: Dboy :(9:30:13 AM) : sold 1 es at 4141
This is not a brag, just a fact, and an observation. That observation being that right now, everything is a fade. If the ES gaps sharply lower, I would look to be a buyer. If it gaps sharply higher, I’m looking to sell.
I also expect ‘at least’ a 100-point ES range. As the old saying goes, take out the buy stops and take out the sell stops.
Our Lean — Danny’s Take
I think it’s going to be the exact opposite of yesterday, if the sell-off is hard after the fed they will rally.
MiM and Daily Recap

The ES traded up to 4153 on Globex after the CPI number rose less than expected and traded down to 4100.25 at 8:37 and traded back up to 4154.00 at 9:23 and opened Tuesday’s regular session at 4139.
After the open, the ES sold off down to 4111.25 at 9:37, traded back up to 4138.50 at 9:56, and dropped almost 70 points down to 4073 at 10:40. I want to point out the sheer number of ‘handles’ the ES traded from the 8:30 number to 10:40 was ‘hundreds of points.’ The ES rallied back up to 4092.50, dropped down to 4075, rallied back up to 4092.50 at 11:15, dropped back down to 4075.50 at 11:26, and popped back up to 4095.50 at 11:35.
It was a mess that began to fade later in the afternoon.
The ES dropped back down to 4041.50 at 1:55, traded back up to 4068.25 at 2:56, and then dropped back down to 4034.50 at 3:08. At 3:46, the ES traded 4063.25, traded 4056 as the 3:50 cash imbalance showed $1.2 billion to buy and traded 4056 on the 4:00 cash close. After 4:00 the ES traded sideways and settled at 4054.50 on the 5:00 futures close, up 35.5 points or +0.88% on the day.
In the end, the ES traded hundreds if not thousands of handles up and down. I know some will disagree, but yesterday’s trade was ‘unhinged’ and as I said to the PitBull, this type of price action — whether it’s a 50-point range or 150 — is not going away anytime soon.
In terms of the ES’s overall tone, there was a mammoth two-way flow, the shorts getting squeezed and tax sellers and Fed hedging selling. In terms of the ES’s overall trade, volume was high, with over 2.8 million contracts traded.
The CME changed the Thursday before the expiration to Monday which will only hasten the rolls (spreads) to move into the March contracts. Therefore we should see oversized index futures right up to Friday morning when the December contracts expire.
Technical Edge
- NYSE Breadth: 59% Upside Volume
- Advance/Decline: 71% Advance
- VIX: ~$22.75
S&P 500 — ES
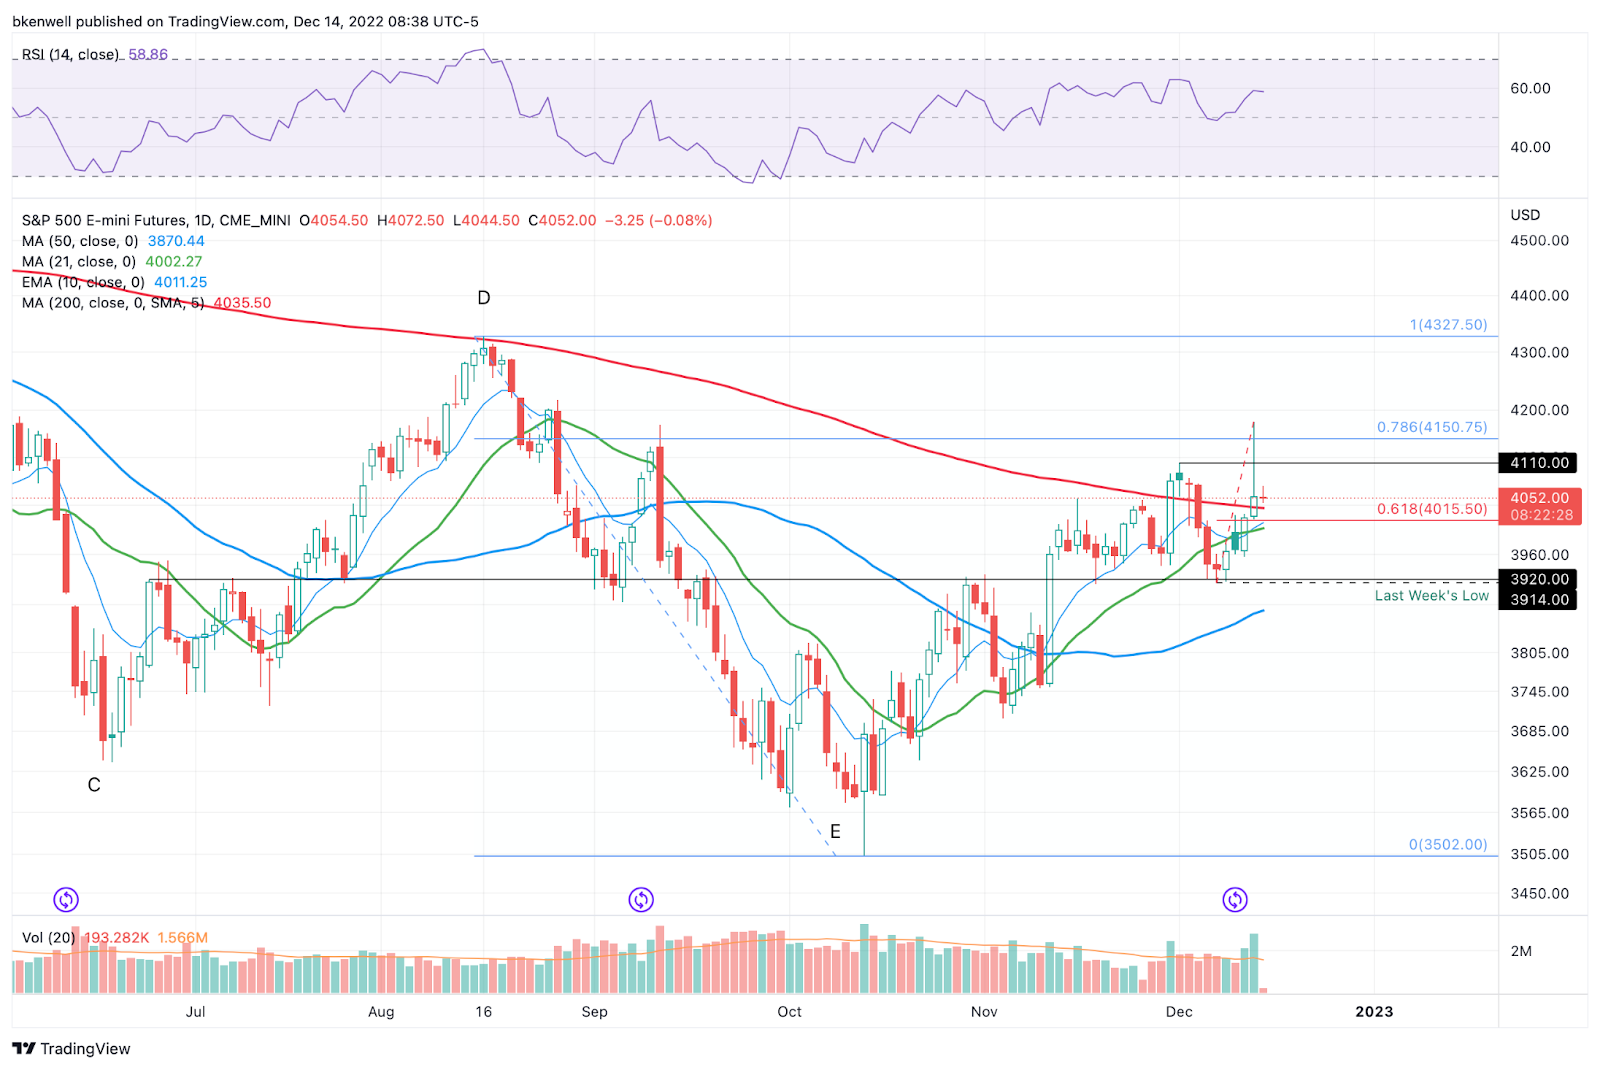
A nasty fade yesterday. I’m now keeping an eye on the 4000 to 4017.50 area. I wouldn’t be surprised if we see the top of that range today — 4017.50, which is yesterday’s low.
They love running the stops on Fed days, but just below yesterday’s low, we also have the 10-day and 21-day moving averages, as well as the 61.8% retracement. Not to mention, breaking this range puts the ES back below 4000.
It will all depend on if Powell takes a hawkish stance or a dovish stance in regard to future rate hikes.
On the upside, 4110 is back in play, followed by 4150, then 4180.
A break below 4000 that’s not reversed could ultimately put 3960 on the table.
SPY
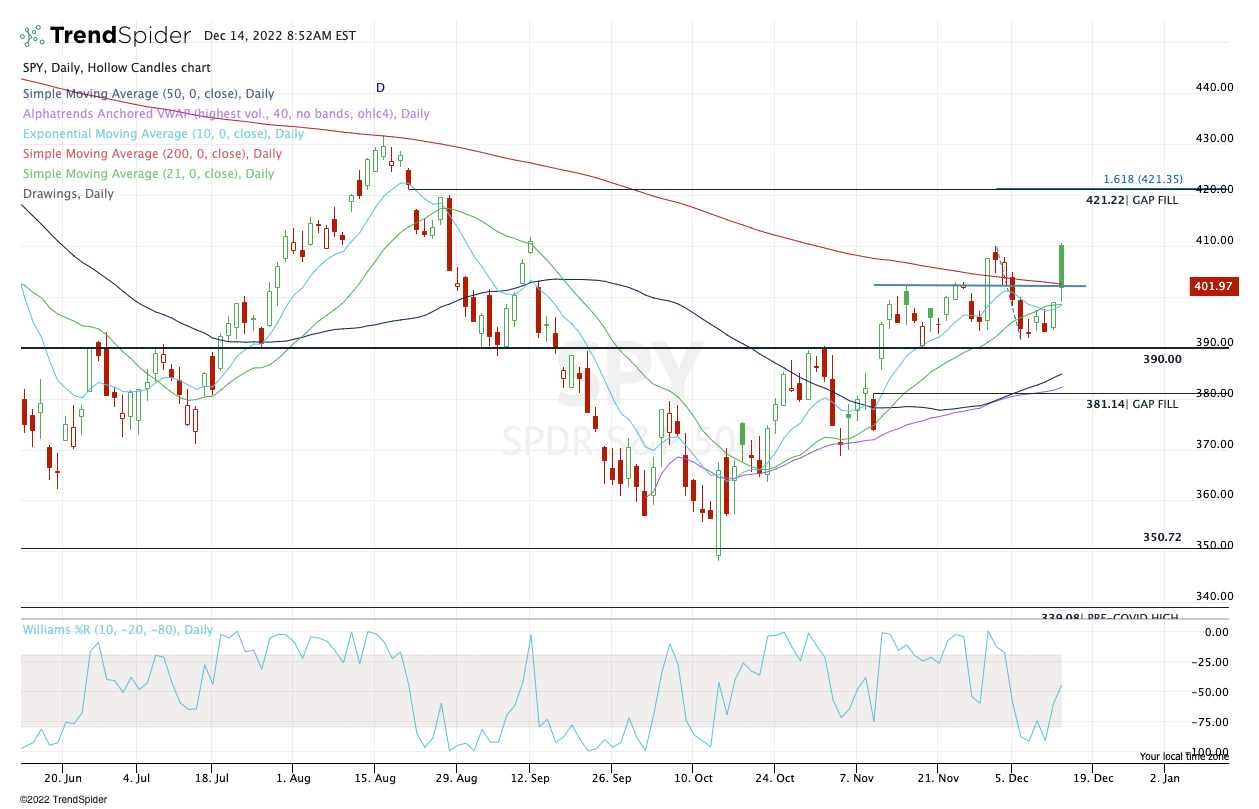
Not pretty, but the SPY held where it needed to after filling yesterday’s gap.
From here, keep a close eye on $398 to $399. That’s the 10-day and 21-day moving averages and yesterday’s low. A break of this area could ultimately put the $392 to $393 area back in play.
On the upside, $410 to $410.50 is really proving to be significant.
If the SPY can clear that, then $421 is certainly within reach (that’s the 161.8% extension of the current and also marks a gap-fill level).
TSLA
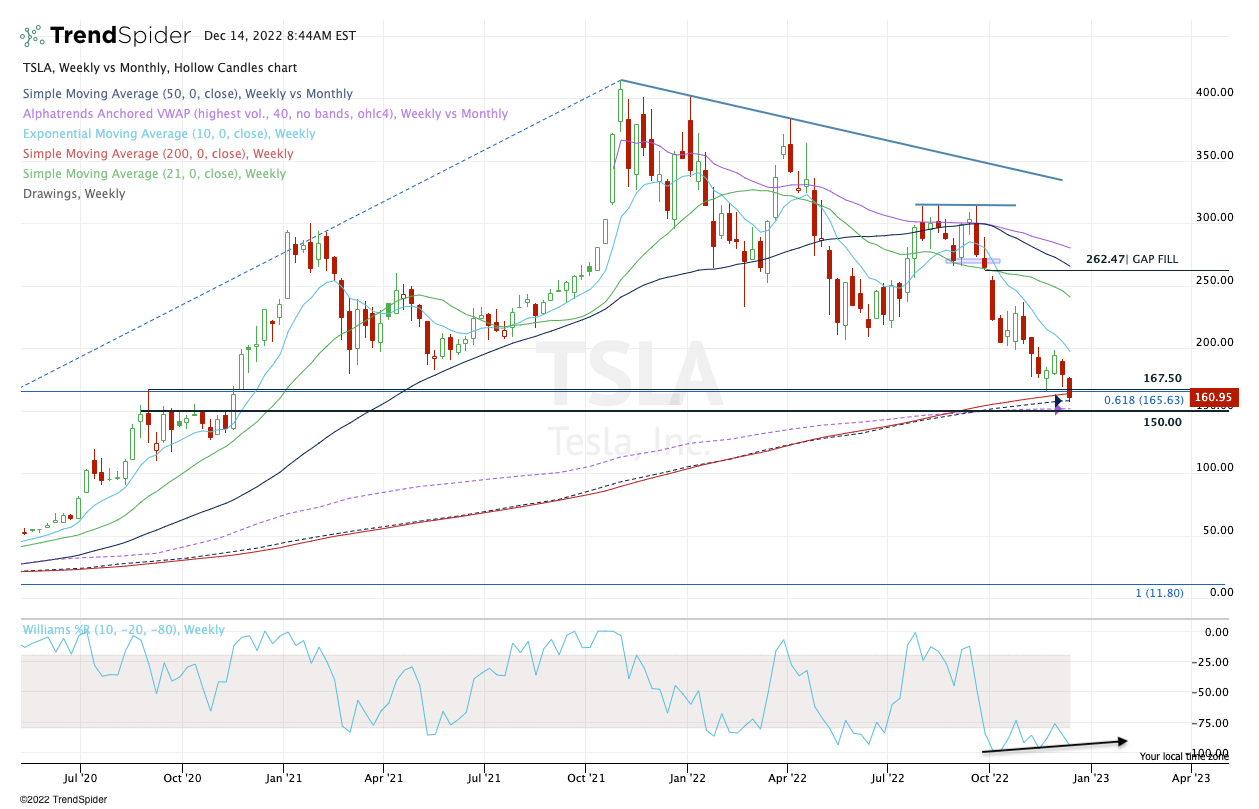
Love Tesla or hate it, it’s hard to deny the area it’s approaching. It will either hold as support or fail, but the line in the sand is drawn.
Between $150 and $160, we have the 200-week moving and 50-month moving averages, the monthly VWAP, the 61.8% retracement and the $150 breakout level. To top it all off, we have some minor divergence on the Williams %R.
If we see ~$150, it might be worth a shot, as we’ll know quickly whether to bail or not.
Open Positions —
- Numbered are the trades that are open.
- Bold are the trades with recent updates.
- Italics show means the trade is closed.
- TLT — Trimmed down to our final ¼ or ⅓ at $108.50. A complete exit is okay too. Those still holding can fish for the $110 to $111.50 area.
- IBM — Love price action allowing us to get down to ½ at $150.50 and hopefully trim more into that up-move yesterday before the fade.
- Can be down to ⅓ or less now and look to trim the rest between $153.50 and $155. Stops at B/E or better.
- CEG — Exit more at $93+, down to ½. Looking for $95 to $96 for small trim (down to ½). Down to ⅓ if we see $97.50+
- Stops at $89 (essentially B/E)
- Ulta — “Down to ⅓ or ¼ or if we trade $482.50+” ended up being a great exit as Ulta faded more than 20 points from the high.
Go-To Watchlist
*Feel free to build your own trades off these relative strength leaders*
Relative strength leaders →
- LNG — keep an eye $150
- CAH
- Retail — TJX, WMT, ULTA
- SBUX
- DE
- CCRN
- AMGN — $265 to $267 is the breakout level and the 50-day moving average.
- MET
- GIS
- REGN
- CI
- MCD
- ENPH, FSLR — solar has strength
- VRTX
- UNH
- MRK
- XLE — XOM, CVX, COP, BP, EOG, PXD (Weekly Charts)
Economic Calendar
Comments are closed