Our View
S&P sits on key support.
I don’t know why there isn’t more concern as inflation tops 9% and delivered its highest reading in more than 40 years.
“The CPI reading for June had its highest reading since November 1981, the Labor Department said on Wednesday. A big jump in gasoline prices—up 11.2% from the previous month and nearly 60% from a year earlier—drove much of the increase, while shelter and food prices were also major contributors.”
I don’t think inflation is going back down. Maybe it will down-tick next month, but that may prove to be temporary. Eventually, inflation growth will slow, but how long will it stick around?
One thing is for sure, it’s going to keep the Fed in a hawkish stance. A week ago, the market was pricing in a ~97% chance of a 75 bps hike (and a ~3% chance of just a 50 bps hike). Remember when 50 bps was big?
After Wednesday’s CPI print, the market is now pricing in a more than 80% chance we see a 100 bps hike. Yesterday, the Bank of Canada surprised investors with a 100 bps hike too — going to 2.5% from 1.5% — and said more would be needed.

Our Lean
I think there was some mid-month buying mixed into yesterday’s rally and I think we could see more of that today.
That said, you can buy the early weakness and sell the rallies or just be patient and sell the 40 to 60-point rips. That worked pretty well yesterday, with many 40 to 50 handle up-moves unwinding.
With early selling pressure in Globex, yesterday’s low (3752) and key support (3740) will be on watch today.
Daily Recap
The ES traded in a narrow range on Globex and dropped 100 points in 4 minutes after the US CPI came out at 8:30. The ES traded 3765.25 on the 9:30 ET future open, down 59 points. From there it rallied up to 3823.75 at 11:05. At 11:45 the ES traded down to 3794.50, then shot back up to 3834.75 at 1:00.
The ES broke back down to 3800 at 2:00, then traded back to 3830 at 3:00. After selling off to 3815.25, it double-bottomed, rallied up to 3826.25 at 3:21, and then dropped almost 20 points down to 3904 as the 3:50 cash imbalance showed $356 million to sell.
From there, it traded up to 3813.50 at 3:57 and traded 3803 on the 4:00 cash close. On the 5 pm futures close, the ES settled at 3796, down 19.25 points or 0.50% on the day.
In the end, it was a good reaction to a bad number, but the post-open strength was met by afternoon weakness. In terms of the ES’s overall tone, it felt like most of the buying was squeezing out shorts. In terms of the ES’s overall trade, volume was higher at 2.15 million contracts.
- Daily Range: 121 points
- H: 3873
- L: 3752
Technical Edge
- NYSE Breadth: 50% Upside Volume
- NASDAQ Breadth: 54% Upside Volume
- VIX: ~$28
Game Plan: S&P 500, Nasdaq, Oil, DLTR
“When things speed up, you need to slow down.”
It’s something a very good trader would say to me often when I was still trying to find my “sea legs” out in the market. At first, I never understood it. How can I slow down when the market’s speeding up? I have to go faster!!
But over time I’ve come to appreciate the simplicity of this advice.
The goal here is to keep things simple and defined when market volatility picks up. That’s where the prep works — i.e. this newsletter — really pays dividends. We have a plan and if it plays out, we know exactly what to do. If it doesn’t, we sit and wait for the next opportunity.
Instead of making 10 trades in a day, cut down to 5 (or even less). Instead of trying to maintain 10 open positions, just working 1-3. None is okay too.
For ex: Is the S&P above or below a key level?
- Above = longs are still okay.
- Below = No longs | cash is fine | seek shorts at/near active resistance.
S&P 500 — ES
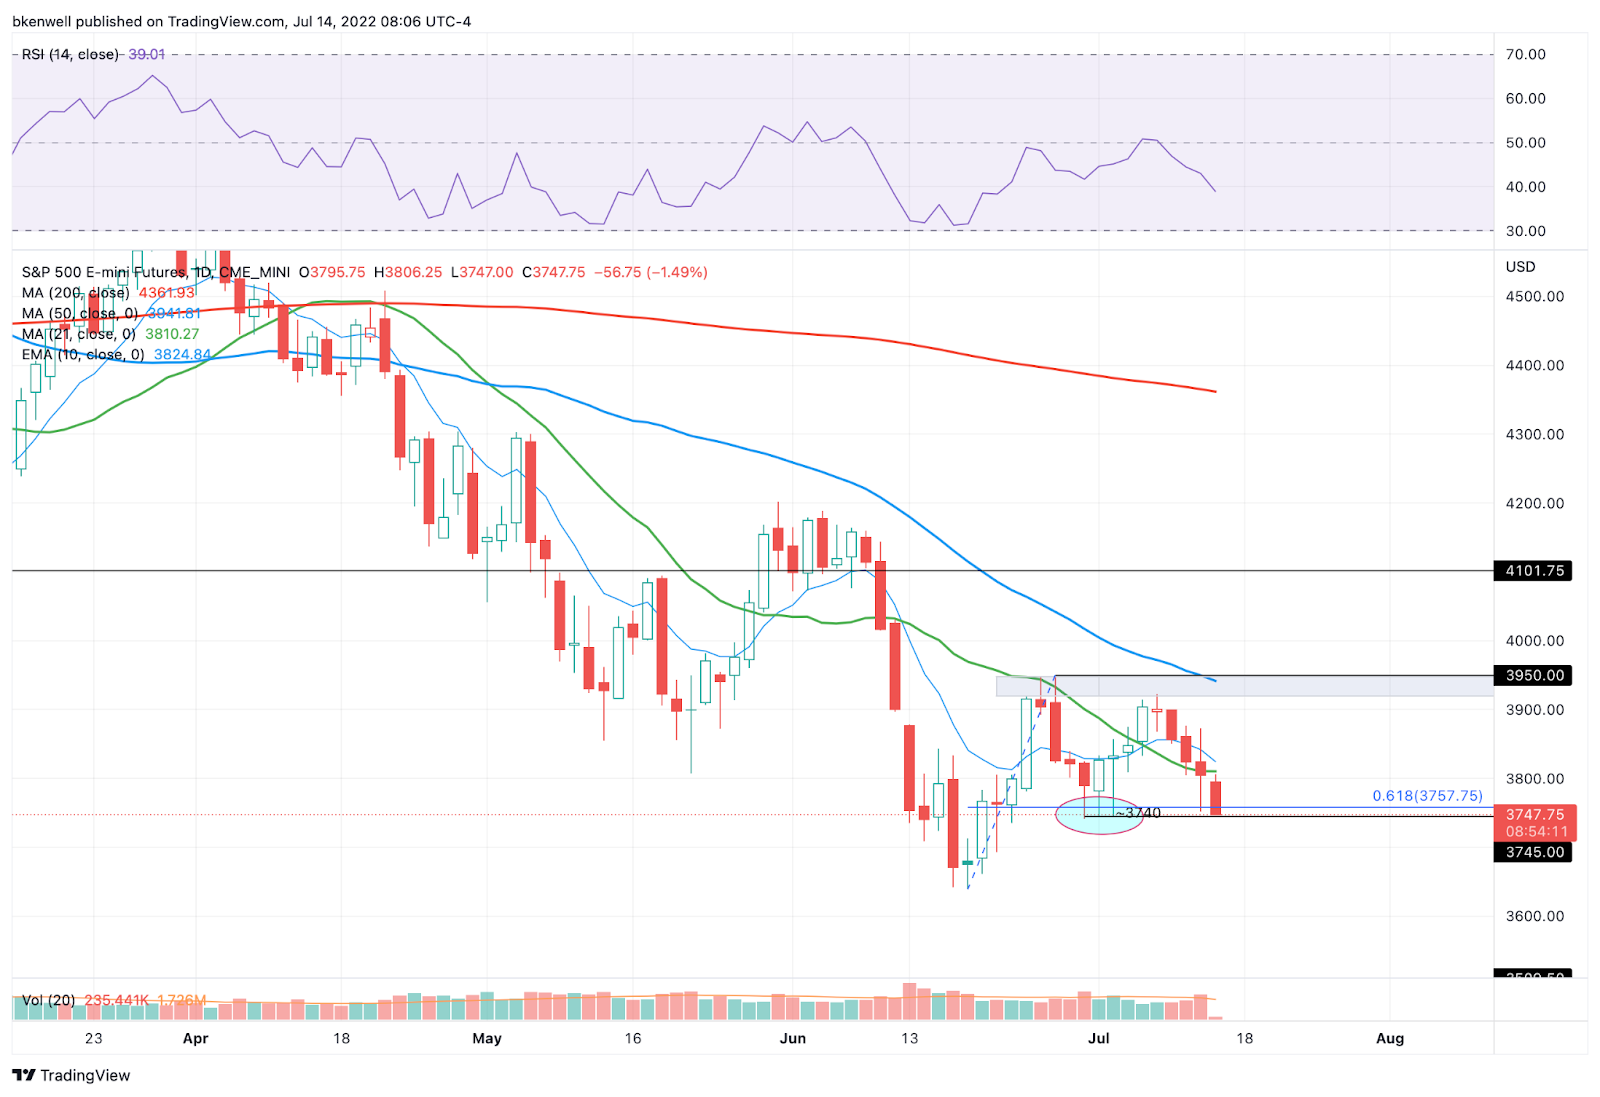
The ES is quickly approaching a very key zone: 3740.
The last two weeks’ lows sit at 3741.25 and 3744. This is a must-hold area for the ES. If it does, bulls need the S&P to reclaim yesterday’s low at 3752 and the 61.8% retracement at ~3758.
If it can do that, we could see a push to 3800 today. 3800 to 3825 is a tough area of resistance right now.
If the ES breaks 3740 and can’t reclaim it, this level could become resistance. In that case, we have 3705 in play and risk retesting the lows.
S&P 500 — SPY

The SPY is very simple. $380.50 is the upside level to clear. Notice how it rejected the SPY yesterday.
On the downside, $374 is key. Below last week’s low and we could fill the gap down to $369.38. Below that puts the $362 lows in play.
Nasdaq — NQ
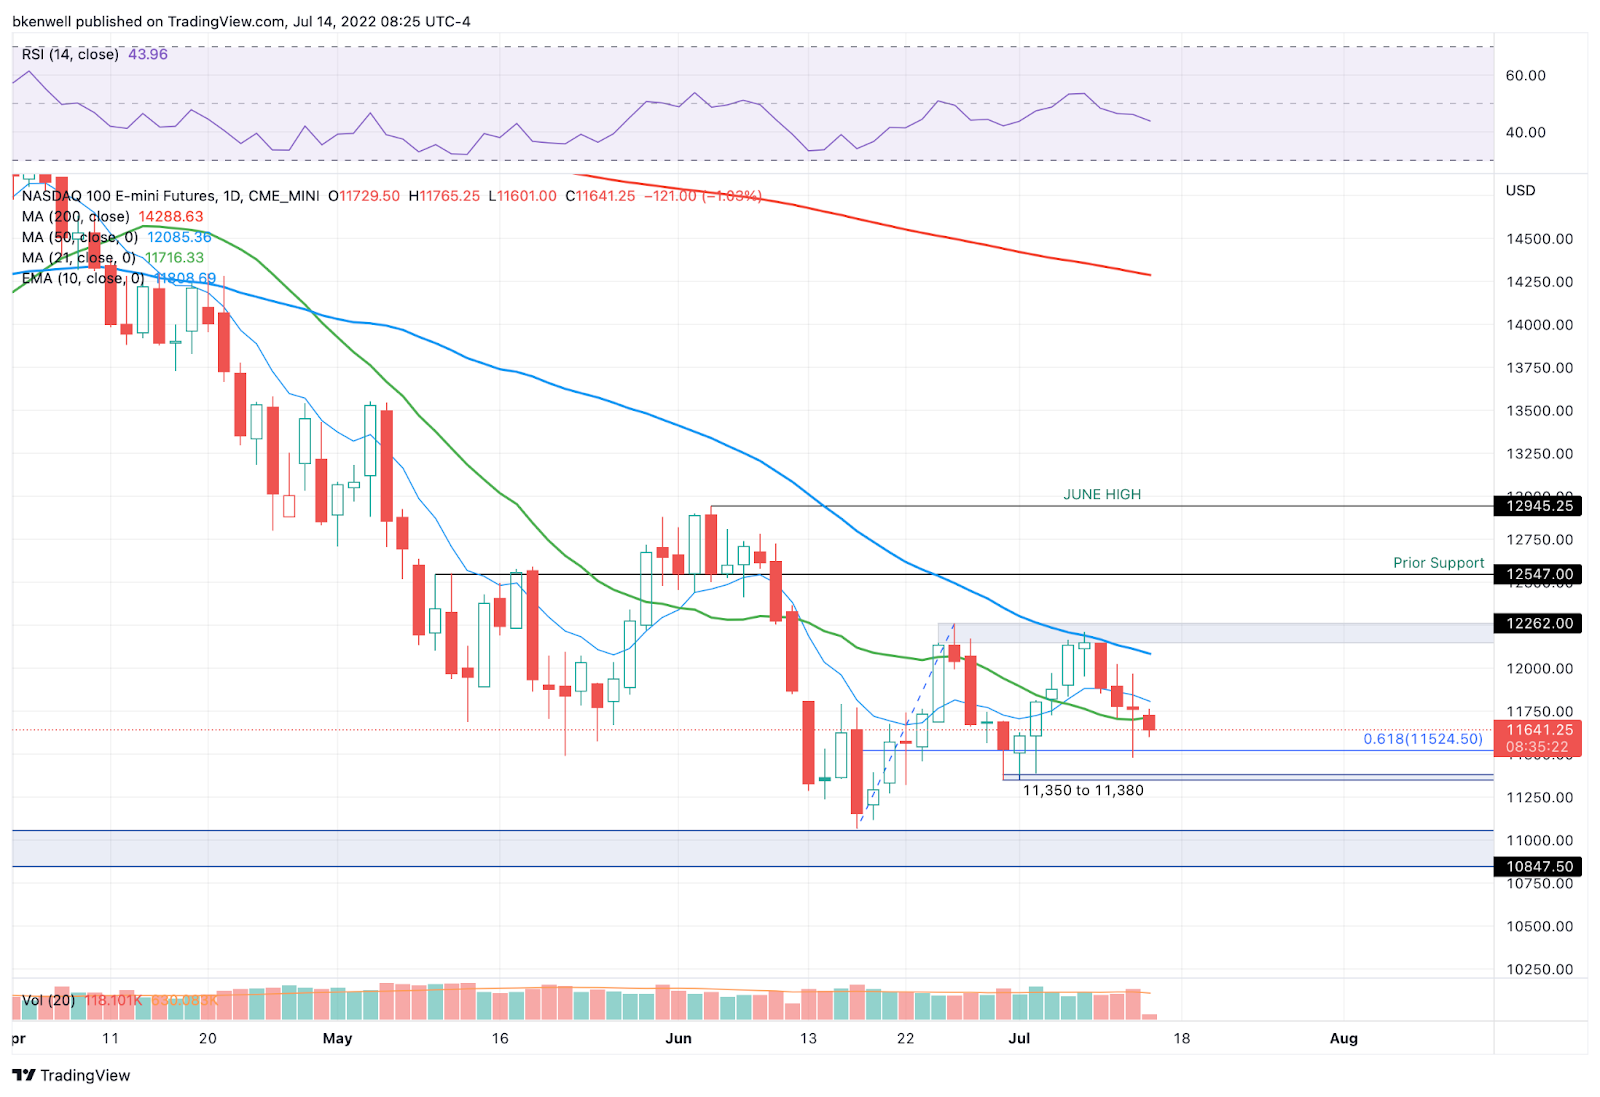
Relatively speaking, the NQ is holding up better than the ES.
Keep an eye on these two levels: 11,480 and 11,525. The latter is the 61.8% retrace and the former is yesterday’s low.
A break below both measures and failure to reclaim them could kickstart a 100+ point drop into the 11,350 to 11,380 zone.
Bulls will want to clear 11,750 to 11,775.
Oil — CL

There should be some decent support in this area. A break of $93 and failure to reclaim could put $88 in play.
However, a bounce from here puts $97 to $98 in play, followed by $100 and the 10-day moving average. I’d be cautious below $92.
Keep in mind, the action here is likely to be volatile, with dollar strength and the words “inflation” and “recession” in every business-related headline around the world.
Gold — GC
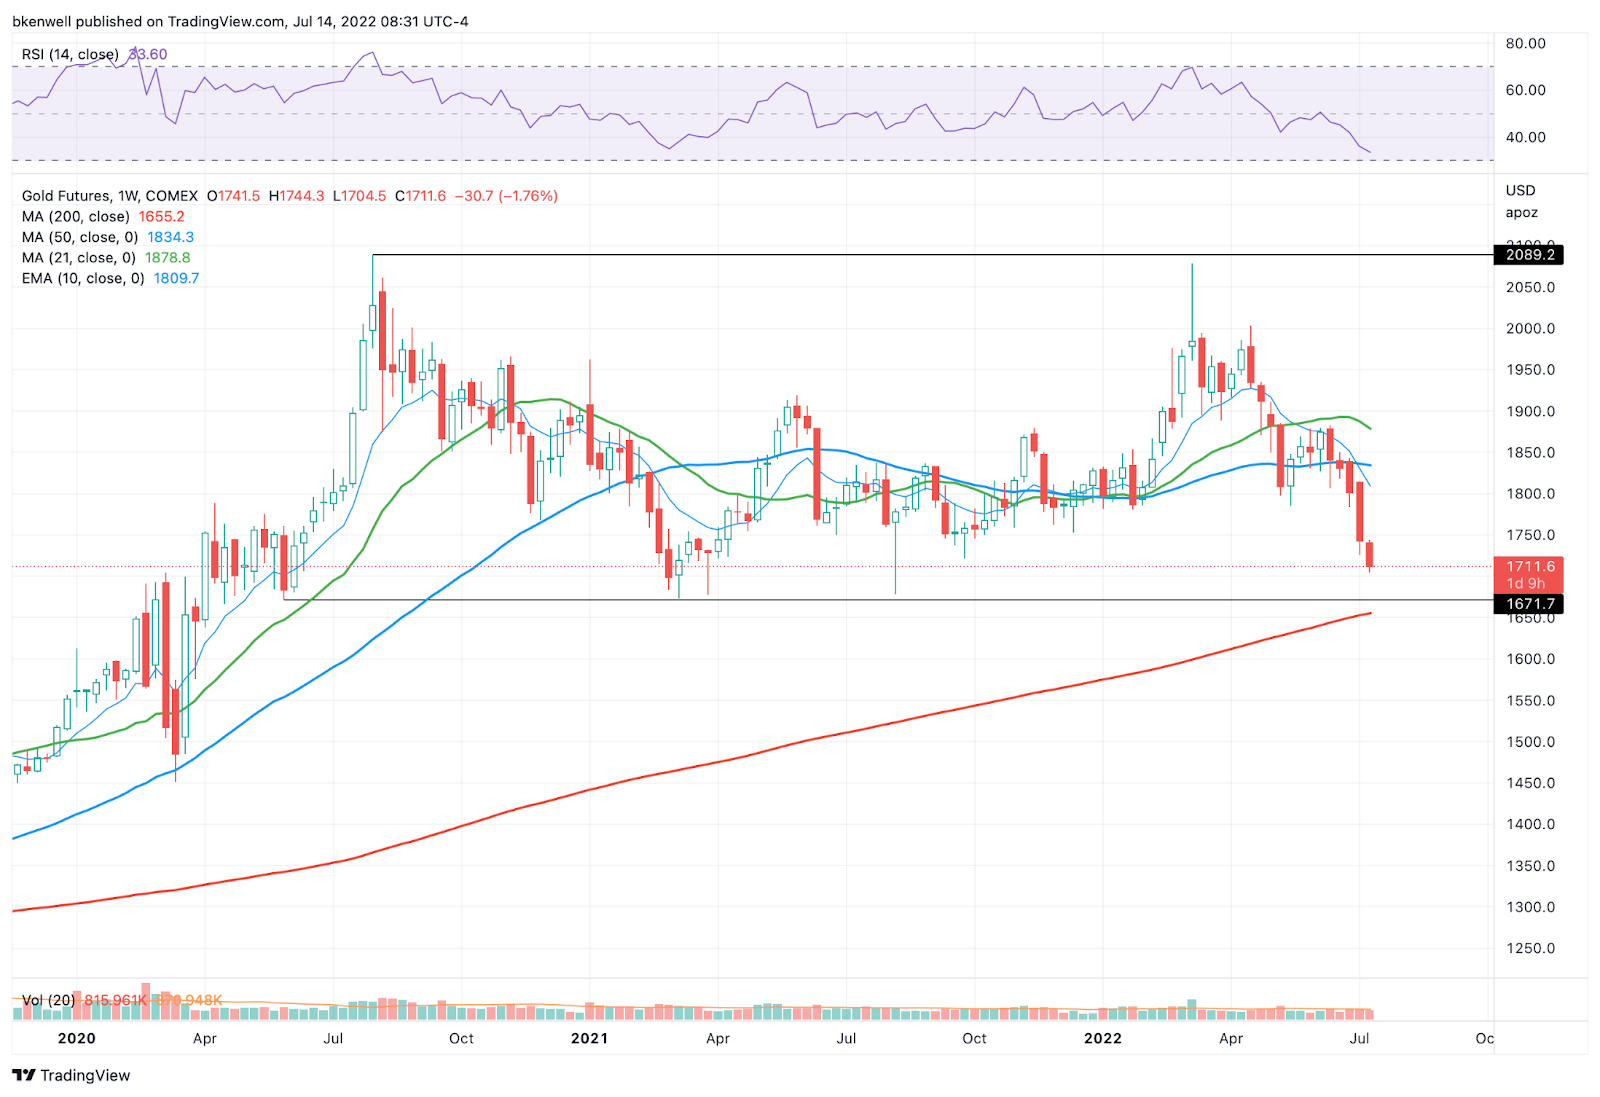
Gold is starting to look a bit more interesting, as we approach the $1655 to $1670 area.
Go-To Watchlist — Individual Stocks
*Feel free to build your own trades off these relative strength leaders*
- Numbered are the ones I’m watching most closely.
- Bold are the trades with recent updates.
- Italics show means the trade is closed.
Trade Sheets: DLTR traded well yesterday.
- MCK — We have hit two trim zones so far on MCK. Feel free to cash the last ⅓ of the position as you see fit. $335 to $340 is a potential upside target if it continues higher. Moving stop-loss up to $315
- $335 hit on Monday, up to you on how to manage from here. I’m holding the last ⅓ against a profitable stop-loss.
- DG — We got our second price target at $256 → That leaves us with one tranche left and looking for $260 to $262 with it. Stop at (~$242.50)
- MRK — Hit Targets 1 & 2 → Now out of ½
- $90 to $91 Stop Loss (or B/E).
- Looking for $95+ for ¼, then not sure. Maybe hold the last ¼ for a push to $100 if we don’t get stopped out.
- GOOGL — Booyah! GOOGL gave us our target at $2,375 and is now into a resistance area. I am out ⅔ here and may fish for a push to the $2,450 to $2,500.
- B/E Stop ($2,270)
- DLTR — Long entry triggered. Hit our first price target yesterday ($167 to $168). Now looking for $169.50 to $170+ for our second trim.
- Stop-loss inched up to $162 or up to B/E. As always, your choice.
Potential Shorts to watch:
- AR — Below $32.85 and can use $34 as initial stop.
- ARCH
- PG — Below $144 could create a flush.
Relative strength leaders (List is cleaned up and shorter!) →
- DLTR
- MRK
- PEP
- ABBV
- UNH
- JNJ
- XLE
- CLR
- VRTX
- DG
- IBM
- MCK
Economic Calendar

As we all know, there’s no crystal ball when it comes to trading stocks, options, or futures. But the Market Imbalance Meter may be as close as it comes. Knowing how the “Big Money” is placing its bets can give our trading room a big wave to ride — or a warning sign to stay out of the water. Come check it out now, risk-free for 30 days.
Comments are closed