If you don’t have time this morning, please take a few minutes sometime today to view our “Big Picture” video on the S&P 500. It highlights this year’s key pattern thus far (3-wave vs. 5-wave moves) and lays out a few possible scenarios ahead of next week’s Fed event.
Good luck today!
Our View
I don’t think there is a comparable time in the history of the stock market that has seen this type of daily, weekly and monthly movements. This isn’t the ‘87 crash, it’s not the 2000 tech bubble and it’s not the credit crisis. There are going to be times when the markets bounce, but keep in mind that we have not seen the lows even if the ES rallies 400 points.
The Fed’s two-day meeting is May 3rd and 4th. It’s going to be the first half a point interest rate hikes to come (more on this in the video). Putin is not going away and China’s markets are in free-fall. Crude oil sold off almost $7 a barrel and then rallied almost $5 off the low…
It’s going to be a long, hot summer.
As for today, keep in mind that Alphabet, Microsoft, GM, GE, UPS, PepsiCo and more report earnings.
Our Lean
The markets are in motion. Everything is moving and you know what? It’s not going to stop. Late last year when the S&P was moving all over the place, the PitBull said all the thrashing and oversized trading ranges were a precursor to even larger ranges. Now in early 2022 we were seeing 100 to 200 point ranges.
That’s not over.
I think the next six months are going to be some of the most volatile on record. It’s a giant liquidation trade with a lot more selling to come. My new philosophy is to maintain a bearish view of the markets and not let the rallies give false hope.
That said, I don’t think the short covering rally is over, but that doesn’t mean the ES can’t flunk again. The ES sold off 300 points, so if you add 150 on to yesterday’s 4296.50 low the 50% retracement comes in around the 4371 level (again, more in this below and in the video).
In most cases after a big rip like yesterday, the ES futures pull back. Our lean is to buy the early pullbacks and sell the rallies.
Daily Recap
The ES opened Monday’s regular session at 4244 and traded down to 4221.250, rallied up to a lower high at 4240.75, and then sold off more than 30 points down to 4207.25 at 10:06. The ES did a little back and fill, traded up to 4224, sold back off down to a higher low and then a buy program hit pushing the ES up to 4251.50 just after 10:30.
As you can see, the ES traded hundreds of points both up and down in less than one hour.
After the rally, the market sold off again, with the ES breaking the morning low at 4207.25 by one point, before snapping higher by 23 points. However, it fell again from here, and this time made new lows at 4195. The breakdown didn’t gain traction though, with the ES climbing 80 handles into the 3:00 hour, rallying to 4275.
From there, the market dipped about 30 handles, down to 4245 before a powerful bounce sent it to new highs on the day as the ES traded 4279 going into the MIM reading, up 48 points from the recent low. The ES traded 4284 as the 3:50 cash imbalance showed $450 million to buy, rallied back up to 4293.50, and then traded 4293 on the 4:00 cash close. After 4:00, the ES rallied up to 4296.50 and settled at 4294.25 on the 5:00 futures close, up 25.5 points or 0.6% on the day.
In the end, we all saw how weak the ES was, at one point breaking below 4200. In terms of the ES’s overall tone, the Musk/Twitter news caused a short-covering rally. In terms of the ES’s overall trade, volume was high at 2.28 million contracts traded — notably, that was ahead of Friday’s volume when it traded 2.04 million contracts and fell 2.8% on the day.
- Total Range: 101.25 points
- H: 4296.50
- L: 4195.25
Technical Edge
- NYSE Breadth: 46.2% Upside Volume
- NASDAQ Breadth: 70.2% Upside Volume
This morning we laid out a nine-minute video talking about the S&P 500 as it tries to digest inflation, the Fed and geopolitical issues. Please give it a watch sometime today!
Game Plan
Volatility is again expanding and the ranges are becoming wider. We talked about stop-losses in the video and what they can signal in these types of environments. For now, we continue to focus on the indices, as individual stock trades become too “iffy” in this type of environment.
Yesterday the markets posted a reversal and it will be key to see if it can gain momentum from here or if it stalls out.
S&P 500

The “Big Picture” of the S&P is laid out in the video. For today, my approach is simple:
Can the S&P regain yesterday’s high at 4296.50?
If yes, can it regain and stay above the Globex high at 4303.50?
If that answer is yes, then we could be looking at a scenario where the 4350 to 4365 range is technically in play.
On the downside, if we can’t reclaim these two levels, my focus will be on the Globex low at 4268, then last week’s low at 4247.50. Below that and 4236 is in play, followed by 4200.
Try to #KISS and Keep It Simple by moving from level to level, even as volatility expands.
SPY

We’re down about 34 basis points in the pre-market as of 8:15 ET. A daily-up over $428.69 could get the SPY moving again.
An intraday close over this level — be it on a 5-, 15- or 30-minute basis — is something I’ll be watching today, potentially putting a larger rally in play.
On the flip side, a break of last week’s low at $425.44 could open the door to lower prices if it gets below this level and can’t regain it. My first downside zone would then be $422.50 to $423.75, followed by a potential move to yesterday’s low.
Bonds

The TLT pushed right into the 10-day and last week’s highs and retreated a bit yesterday.
They are gapping up again today, but let’s see if it can take out yesterday’s high.
Individual Stock Trades — TGT, PANW
TGT

Gap-down action held where we wanted it too, now let’s see if we can get a daily-up rotation from here. If this stock gets at or near Monday’s high, I would be trimming — roughly ½ — and settling into the position with break-even stop-loss.
I am not trusting of this market quite yet, despite yesterday’s bounce, hence the desire to take more profit, more quickly.
PANW
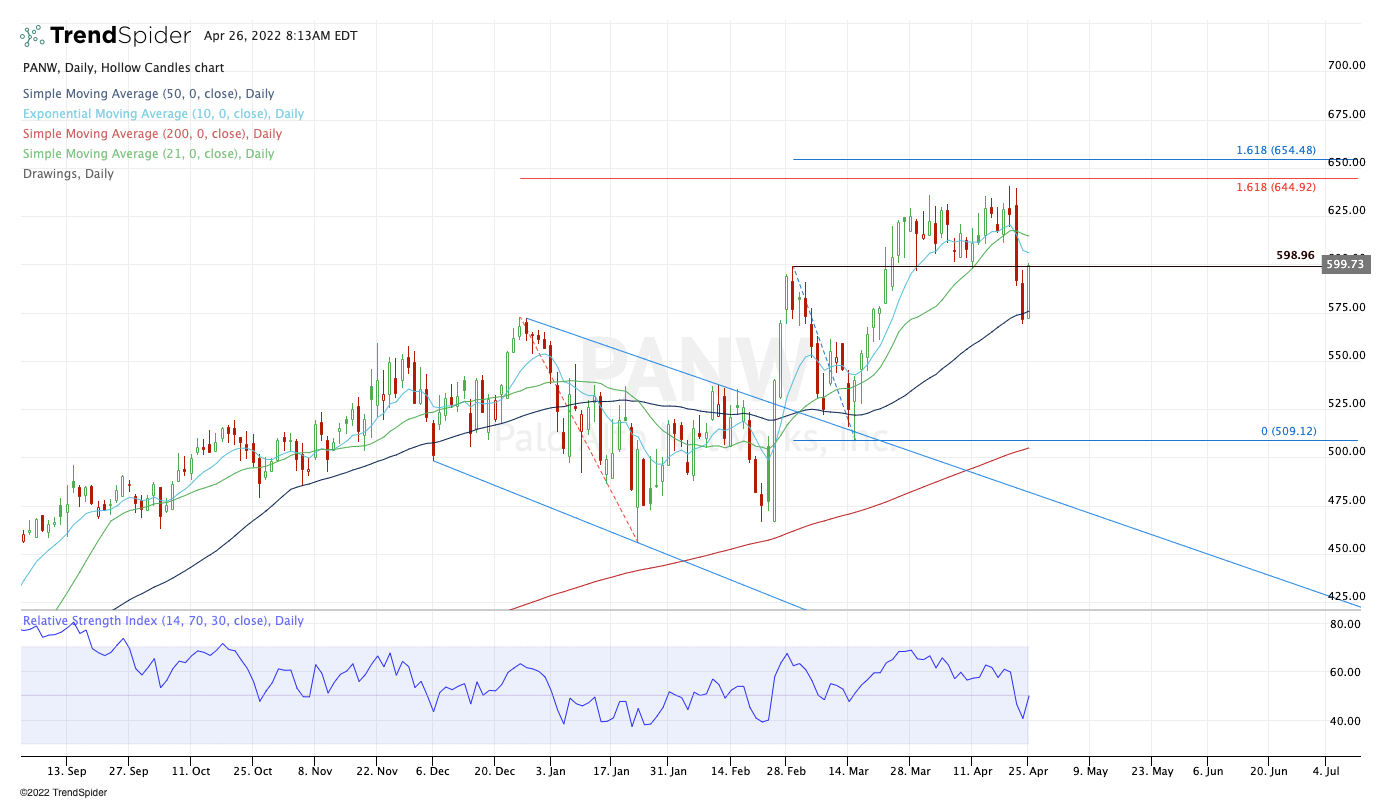
Not necessarily a trade here, unless perhaps PANW goes daily-up over Monday’s high. It does have the short-term moving averages ahead, but I mostly want to keep an eye on this name.
It has been a relative strength leader in tech and bounced hard from the 50-day. Now it tries to reclaim the key $598 to $600 zone.
*Feel free to build your own trades off these relative strength leaders*
Numbered are the ones I’m watching most closely. Please look at these closely, as there are several updates (the most recent of which are noted in bold).
A huge number of our B/E stops were hit last week, leaving us with virtually no trades left on the books. Some runners may be in play with WMT and TGT.
- TGT — $250 trim spot hit → A full exit is okay. Otherwise look for $265-ish on remaining ⅓ of position. Stop-loss either at B/E or raised to $235. Your preference.
- WMT — Trim at $158 → B/E Stop. Inside week. Now looking for inside-and-up rotation over $158.29. If so, it puts $162 in play for small trim, otherwise $165 to $170 is our longer term target.
Relative strength leaders (List is getting longer!) →
- AR — watch for test of 10-day
- MAR — back on the list
- CAT
- VRTX
- PANW
- ABC
- DOW, NEM
- DLTR
- COST
- MCK
- BRK.B
- XLB — ADM, NTR, CTVA, NEM, DOW
- ABBV
- FLR
- JNJ
- XLU
- BMY
- Energy — FLNG, XLE, APA, CNQ, CVX, ENB, PXD — etc.
- PANW
- AMGN
- ABC
- UNH
- VRTX
Economic Calendar

As we all know, there’s no crystal ball when it comes to trading stocks, options, or futures. But the Market Imbalance Meter may be as close as it comes. Knowing how the “Big Money” is placing its bets can give our trading room a big wave to ride — or a warning sign to stay out of the water. Come check it out now, risk-free for 30 days.
Comments are closed