Especially as volumes die off into year-end.
Follow @MrTopStep and @BretKenwell on Twitter and please share if you find our work valuable.
Our View
I have been paying attention to SpotGamma for over the last two years and for the most part they have been ‘spot’ on. Consider this:
According to SpotGamma, major resistance remains at 3900, while support can [be] found at 3850, the previously discussed JPMorgan “vol killing” collar at 3835, and eventually 3800. here, SpotGamma remains of the opinion that the S&P holds the 3800-3900 into Friday, 12/30 OPEX, and “for this week, this suggests that SPX moves to either side of this range should mean revert back into the 3835-3850 area.
The most vivid example of the JPM collar in action came just after 10 am ET this morning when stocks slumped sharply in a low volume and liquidity air pocket and then stopped the drop just inches away from the 3835 level, before reversing sharply lower.
It’s hard to believe the collar will keep things in such a tight trading range, but with the VIX at $21.50, that may end up being the case. Especially on light volume and with many traders and fund managers out of the office for the week.
Lastly, to note:
Beyond December and looking into 2023, SpotGamma believes that January will feature much more relative movement (volatility), as the pin is pulled on the 3835 area with 12/30 expiration (and as the “January effect” is no longer a driver of returns as discussed here). Further, there remains a significant catalyst with the very large equity expiration in January.
Our Lean — Danny’s Take
It’s all about the final 3 days and what’s left of the tax selling and the end-of-the-year rebalance. The former should finish up today. The latter may go on a bit longer.
I think it’s fair to say the ES will continue to struggle as long as the NQ is weak. That was the story yesterday as the S&P tried to push through Friday’s high multiple times, but the lag in tech — with Apple finally making a new 52-week low and TSLA making its 10th straight 52-week low — was an anchor to tech.
There should be a very high level of ‘rotations’ like buying bonds and selling S&P or buying Russell / sell tech or some other combination. When the options expire on Friday combined with the rebalance, there should be some very big volume prints. I’m not sure the MIM can beat the DEC quad witchings total $5.6 billion (to buy), but it should be big.
Our Lean: It seems like traders that are waiting on the Santa Claus rally are dreaming. That said a lot can happen in the next 3 sessions. The big rallies on Globex have been failing and while it’s early, it looks like we’re seeing that again today as some weakness creeps back in near 8 a.m.
On the upside, my key levels are 3872.50 and 3897 to 3900.
On the downside, a break of 3855.50 puts 3837 to 3842 in play, followed by 3821 and 3800 to 3806. Feel free to jot those down if it helps.
MiM and Daily Recap

The ES traded up to 3900.50 on Globex and opened Tuesday’s regular session at 3870.25, then sold off down to 3837.25. After the drop, the ES rallied up to 3873 at 10:47, pulled back down to the 3857 level, and then rallied up to a lower high at 3772.25 at 12:15. From there, it traded back down to ~3846 at 2:43, then bounced back up to 3864.75 at 3:41.
The ES traded at 3857.50 as the 3:50 cash imbalance showed $1.5 billion to sell, traded ~3856 on the 4:00 cash close, and settled at 3856 on the 5:00 futures close, down 12.25 points of -0.32% on the day. The NQ settled at 10,912, down 155 points or -1.40%.
In the end, the ongoing weakness in the Nasdaq continues to be the driving force behind the S&P. In terms of the ES’s overall tone, I think it would have rallied if not for the NQ weakness. In terms of the ES’s overall trade, volume was low at 974k million contracts traded.
Technical Edge
- NYSE Breadth: 50% Upside Volume — chop
- Advance/Decline: 43% Advance
- VIX: ~$21.50
Individual trades come in waves when the environment is optimal and the R/R skews in our favor. For years, there would be individual trades for months on end. But in a bear market, they come in short 4-6 week bursts, then require patience for things to reset.
The “reset period” is when many traders tend to give back their gains.
Is it “boring” to wait? Yes, but it’s also what the environment calls for and we must always respect the environment.
Just like in surfing, we cannot control the waves or the ocean. We have to wait for the best setups and then take our shot. We will still fall sometimes, but we will survive. If we were to paddle out every day regardless of conditions, eventually the monsoon would take us under.
S&P 500 — ES
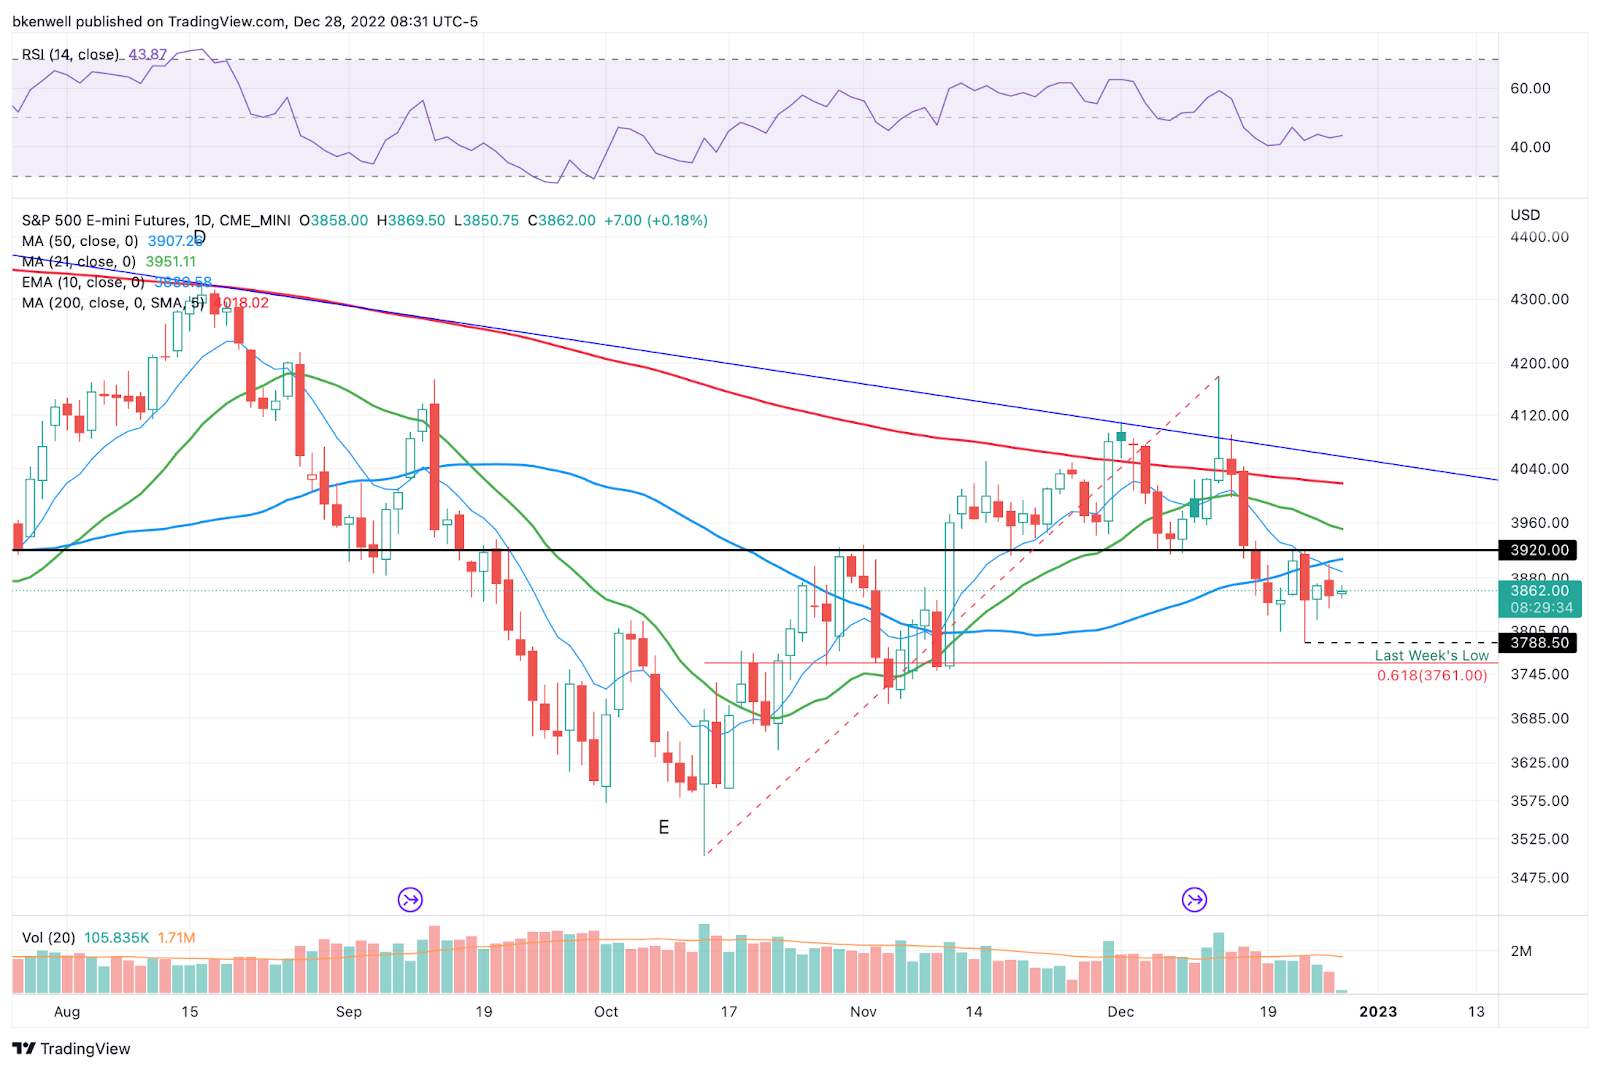
As Danny mentioned, I continue to think of 3900 to 3920 as a brick wall on the upside. If the ES can hurdle it, then there could be some room to run. Until then though, traders have to protect themselves by trading tactically and defensively.
On the downside, a break of 3837 opens the door down to 3788.

The ES has technically put in four higher lows since yesterday’s low. However, it’s clearly struggling with the 3870 to 3876 area.
For now, we must respect this area as resistance, but if the ES can push through, then that’s what opens the door to 3900-ish.
On the downside, a break of 3850 to 3852 is what puts yesterday’s low back in play at 3937.
SPY
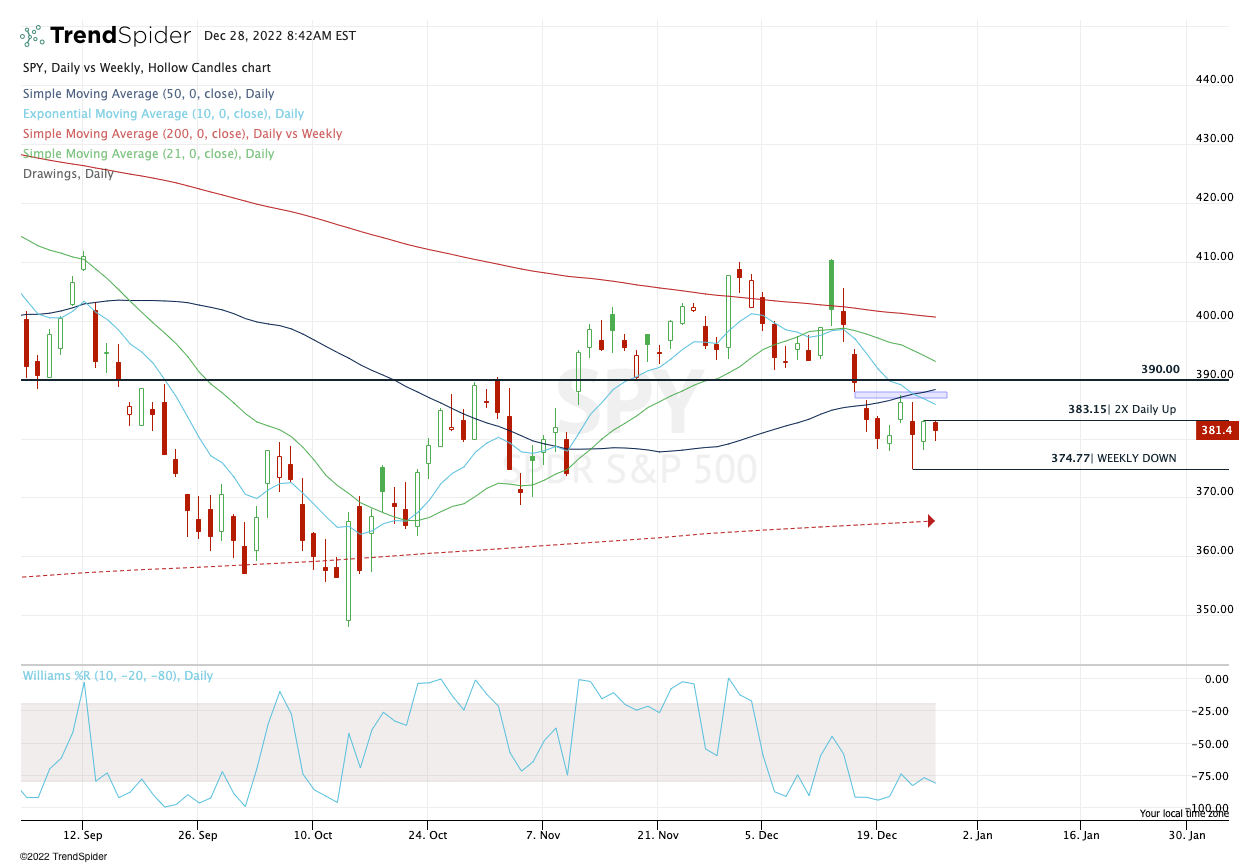
2x daily-up over 383.15 that doesn’t reverse opens the door up to the declining 10-day moving average, which the SPY hasn’t actually touched since Dec. 14 (while the ES has been rejected from this measure twice in three sessions).
Above that could put the $386.50 to $388 area in play, but again, until it can regain $390 it’s hard to trust the rallies.
On the downside, a break of $379.65 puts $378 in play, then last week’s low near $375.
QQQ

We may eventually get a quick, heated rally in the Qs, but even then it’s likely just a rally to sell until it can regain some other levels of significance.
A break of $262.50 opens the door to $259, but a break of $259 puts the 52-week low in play near $254.25.
On the upside, I’m selling the rally if we see the declining 10-day. Above it puts $278.50 to $280.50 in play, which is also a “sell” in my mind.
Open Positions —
- Numbered are the trades that are open.
- Bold are the trades with recent updates.
- Italics show means the trade is closed.
- UUP — Ideally needed a close back over last week’s high of $27.95 and we closed AT $27.95. Long against $27.75 is fine with a ¼ to ⅓ trim at $28.15 to $28.25. Ideally looking for $28.40+
- LNG — Long from ~$151, now Trimmed ⅓ at $157.50. B/E Stop (but aggressive traders can use $147). I prefer B/E, for what it’s worth. $162 to $163 is the next trim spot, down to ⅓.
- TLT — Slow start but we’ll see. I will feel better about TLT if it can clear and hold $101.10.
- For now I’m using $98 as my stop. On the upside, can consider a small trim at ~$102, but really I’m fishing for $103.40 and the declining 10-day.
Go-To Watchlist
*Feel free to build your own trades off these relative strength leaders*
Relative strength leaders →
- LNG — keep an eye $150
- SBUX — nicely weekly-up setup after 10-week ema reset.
- DE — gap-fill & 10-week would be attractive for potential longs
- HON — weekly
- CAH
- LMT, RTX, NOC
- MET — weekly
- GIS
- CI
- MCD — weekly
- ENPH, FSLR, CEG — solar has strength
- VRTX, UNH, MRK
- XLE — XOM, CVX, COP, BP, EOG, PXD (Weekly Charts)
Economic Calendar

Comments are closed