Note To The Readers
I would like to explain something. It goes without saying but there have been a lot of trading account blow-ups this year. It’s not hard to find yourself on the wrong side of a trade when the S&P moves over 200 points in two days, while the Nasdaq moves 1,000 points with all the whip-saws and false starts in between. So if you are having a hard time, be smart, take a step back for a few days and when you start trading, trade less and pick your spots better.
Like the PitBull said: My best trade ever was getting out of a loser and I saw that play out as true for many years with many other traders.
Ragin’ Inflation
There is no doubt the Russian invasion of Ukraine will slow global growth and help push inflation higher. Last night I filled up my gas tank in my car and it cost $87.50. I don’t know the exact date, but I think around August 2020 a fill-up was around $40. Obviously the situation is different now than a few months after Covid (and negative oil prices in April), but it’s still sticker shock to consumers and a big burden to commuters living paycheck to paycheck.
Many people that were around in the 1970’s understand what record-high inflation looks like:
- Inflation in the 1970s was way higher than today and accelerated over the decade. Starting from about 2% in the late 1960s, inflation rose to 12% 1974 and 14.5 percent in 1980
- In 1970 the average home mortgage interest rate was 8.5%.
- The Fed tried to choke off inflation by raising the Fed funds rate until it hit 21%!!
- The DJIA, which was just above 800 at the start of the 1970s, had only advanced to about 839 by the end of the decade, an overall gain of 5% over this 10-year period.
- On Dec. 6, 1974, the two-year bear market finally bottomed, marking a 43% decline for the Dow in less than two years. The S&P 500 closed at 65.01 and the Dow Jones Industrial Average closed at 577.60.
We learn from the past, but a large segment of the trading community was not even born yet. Many weren’t even in the markets during the financial crisis ~15 years ago.
The average cost for a gallon of gas jumped to $4.11 a gallon in 2008 — a record at the time — and now it’s at $4.17 a gallon. I’m not saying that the economic crises are the same as the 70s, but I do think there are some notable similarities.
That said, I also think we are only at the tip of the iceberg for the current crisis.
Our View
When I was at my S&P desk and the pit was flooded with orders and the quote boards were flashing all over the place, you really could get a feeling for what was going on. News always hit the floor first because there were thousands of accounts that would call the floor at any moment.
There actually was a rhythm to the pits and the order flow. Today it is all headline and news-driven algos directing traffic.
These markets can run, but they can’t hide and it’s the worst start to a year since 2008. The global stock markets have never moved so much so quickly.
While yesterday was an inside day, it still produced a 75-point trading range, which is high by historical standards even if it’s considered “calm” in the current environment. The DAX did something unheard of the other day, rallying ~8%. That’s not normal.
I don’t want my bullish friends to think I forgot them — I haven’t, I’m a bull at heart — but I just don’t have a good feeling about the level of risk right now, both economically and geopolitically.
Our Lean
- It looks like the ES wants to go higher, but…
- The ES hasn’t been able to hold the rallies.
That said, our lean is for higher prices. The news this morning is that Putin is saying there has been a positive shift in talks with Ukraine, which created a big pop in the futures. 4340 is still a key level on my chart.
Daily Recap
After Wednesday’s big rally (on lackluster breadth), the ES opened lower by about 50 points from the prior close, trading ~4228 at Thursday’s open. It shot up 28.50 points to 4256 at 10:20, a high that would stand until late in the afternoon.
The ES endured six-straight lower closes on the 15-minute chart on its way to the session low of 4207, which was made just after 11:30 and down 49 points from the high. The ES popped 27.50 points to 4234.50 just after 12:15, pulled back to a higher low of 4213.50, then ripped higher by 50 points up to ~4264 just before 3:00.
Over the next hour, the ES continued to dip down to 4245, but each dip was bought as it came into the 3:50 cash imbalance which came out at $1.1 billion to buy. The ES ripped to the session high of 4267.50, but closed at 4258 on the 4:00 cash close. At 5:00, it settled at 4257.25, down 22.50 points or 0.53%.
In the end, it was an inside day and a choppy one at that! As for the ES’s overall tone, it was firm but not strong. As for the ES’s overall trade, 1.7 million contracts traded on the day.
- Total Range: 75.25
- H: 4282.25
- L: 4207
- C: 4257.25
Technical Edge
- NYSE Breadth: 47% Upside Volume
- NASDAQ Breadth: 35% Upside Volume
Mixed breadth after a mixed day. Thursday did not give us much excitement but for those of us who look at the market as a puzzle, it did give us a clue to work with.
On Tuesday and Wednesday, the markets pulled back but did not retest last month’s low. They bottomed just above the low and turned higher with Wednesday’s big rally. While the gains did not make as much progress as bulls’ had hoped, Thursday’s action left us with an inside day.
Now that inside day could resolve in the bears’ favor, but at the very least it gives traders a range to navigate against!
Game Plan
Even after the volatility of the last few days, the levels in yesterday’s video remain in play. That’s how I will navigate Friday for the ES, NQ, Gold and Oil.
The futures now sport a big pre-market pop due to positive comments out of Eastern Europe.
My question becomes multifold:
- A pre-market fade seems more than possible in this environment, especially under the premise of: Who wants to go home long into the weekend?
- Yes, there is risk to going home short too, but the fear has been on the downside.
- The Fed is next week. Do we rally into that event or decline into it? I have been bracing for the latter, but we’ll see what today brings.
S&P 500 — ES
- Feel free to extrapolate this layout to the SPY.
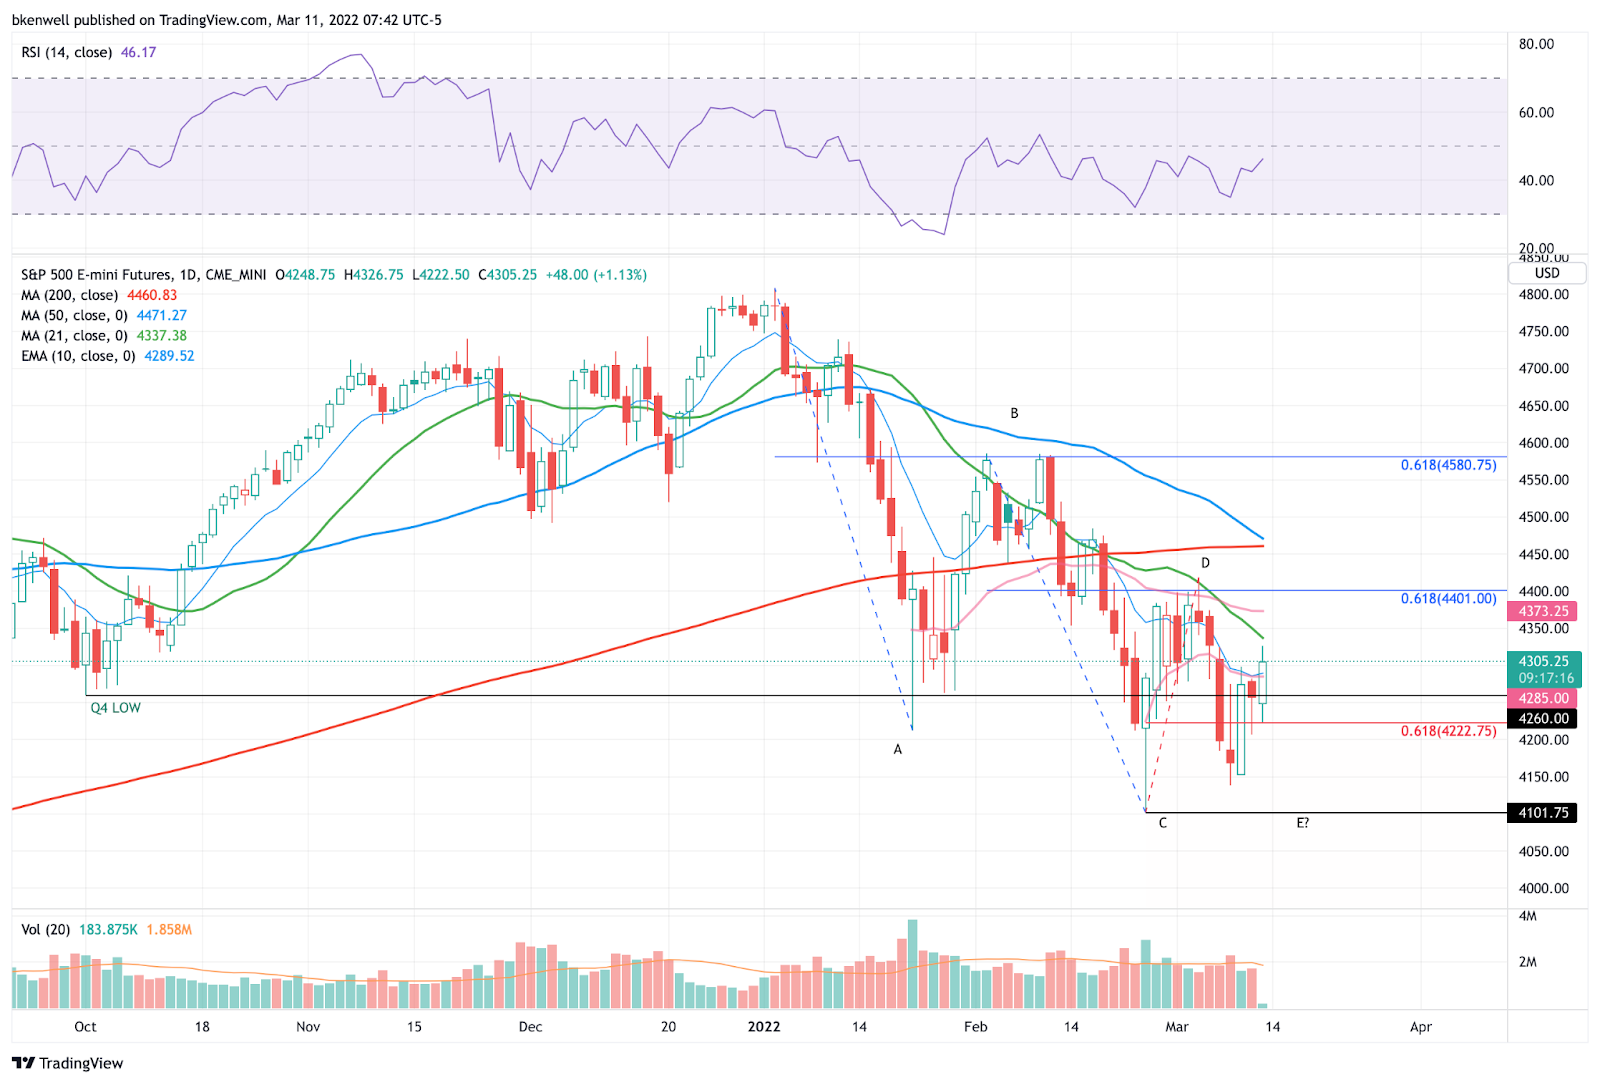
*Just go level-to-level. “If 4275 fails on the downside, it puts 4260 in play.” “If ES clears 4312, the 21-day is in play.”
The upside levels are:
- 4312
- 21-day sma
- 4375
- 4400
Downside levels of interest:
- 4282 — we don’t want to lose yesterday’s high and the 10-day ema.
- 4275
- 4257-60
- 4223 (remains a key pivot and the O/N low)
SPY

I know we talk about the ES a lot, but here’s a weekly view of SPY just for some perspective. Over $432 puts $437.50 in play, then $440. Below last week’s low of $427.11 keeps the bears in control, IMO.
Nasdaq — NQ
- Feel free to extrapolate this layout to the QQQ.
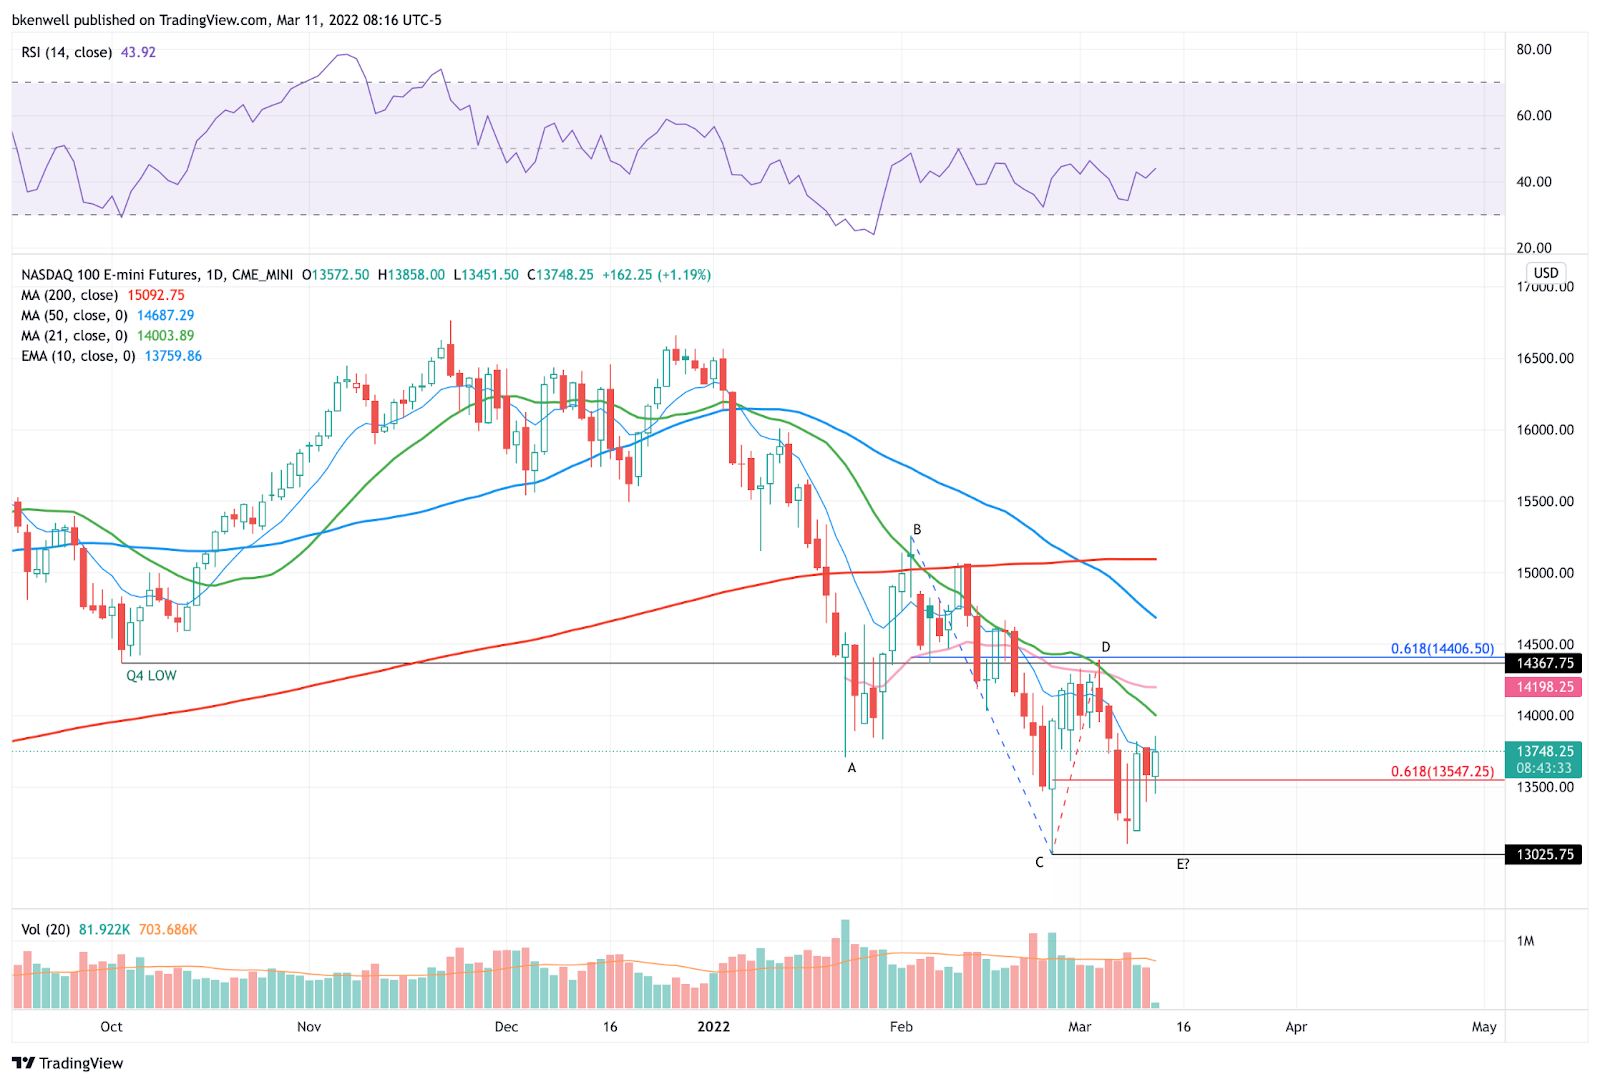
Plain and simple: NQ has to clear yesterday’s high of 13,778 and the 10-day ema. Above it opens the door to 14,000 and the 21-day.
Below 13,550 puts 13,395 to 13,450 in play.
Crude & Gold — *Covered in Video*
*Volatility remains incredibly high in the commodities space. If trading the futures, keep that in mind. Consider smaller position sizes and honor your targets and stops.
Crude
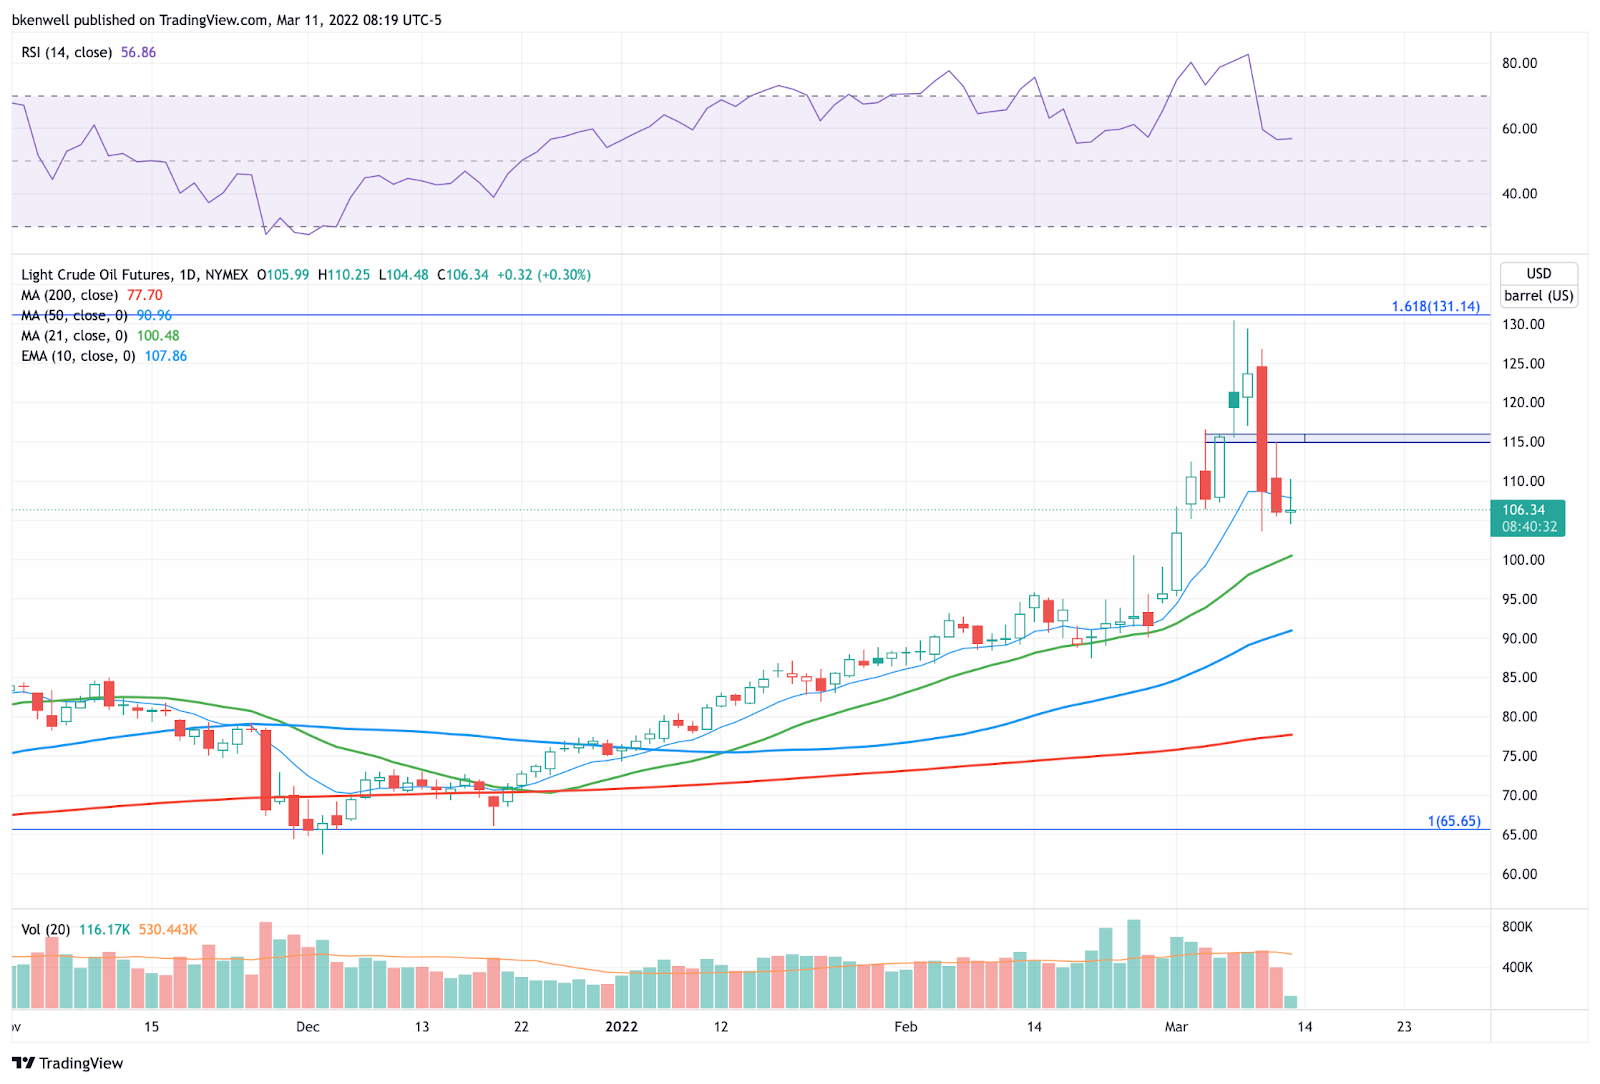
Despite the volatility, I feel like we have navigated this one pretty well.
Crude was rejected by the $115 to $116 area and gave us an inside day yesterday. An inside-and-down rotation could put this week’s low in play near $103.50, followed by our big downside level at the 21-day sma and $100.
Gold
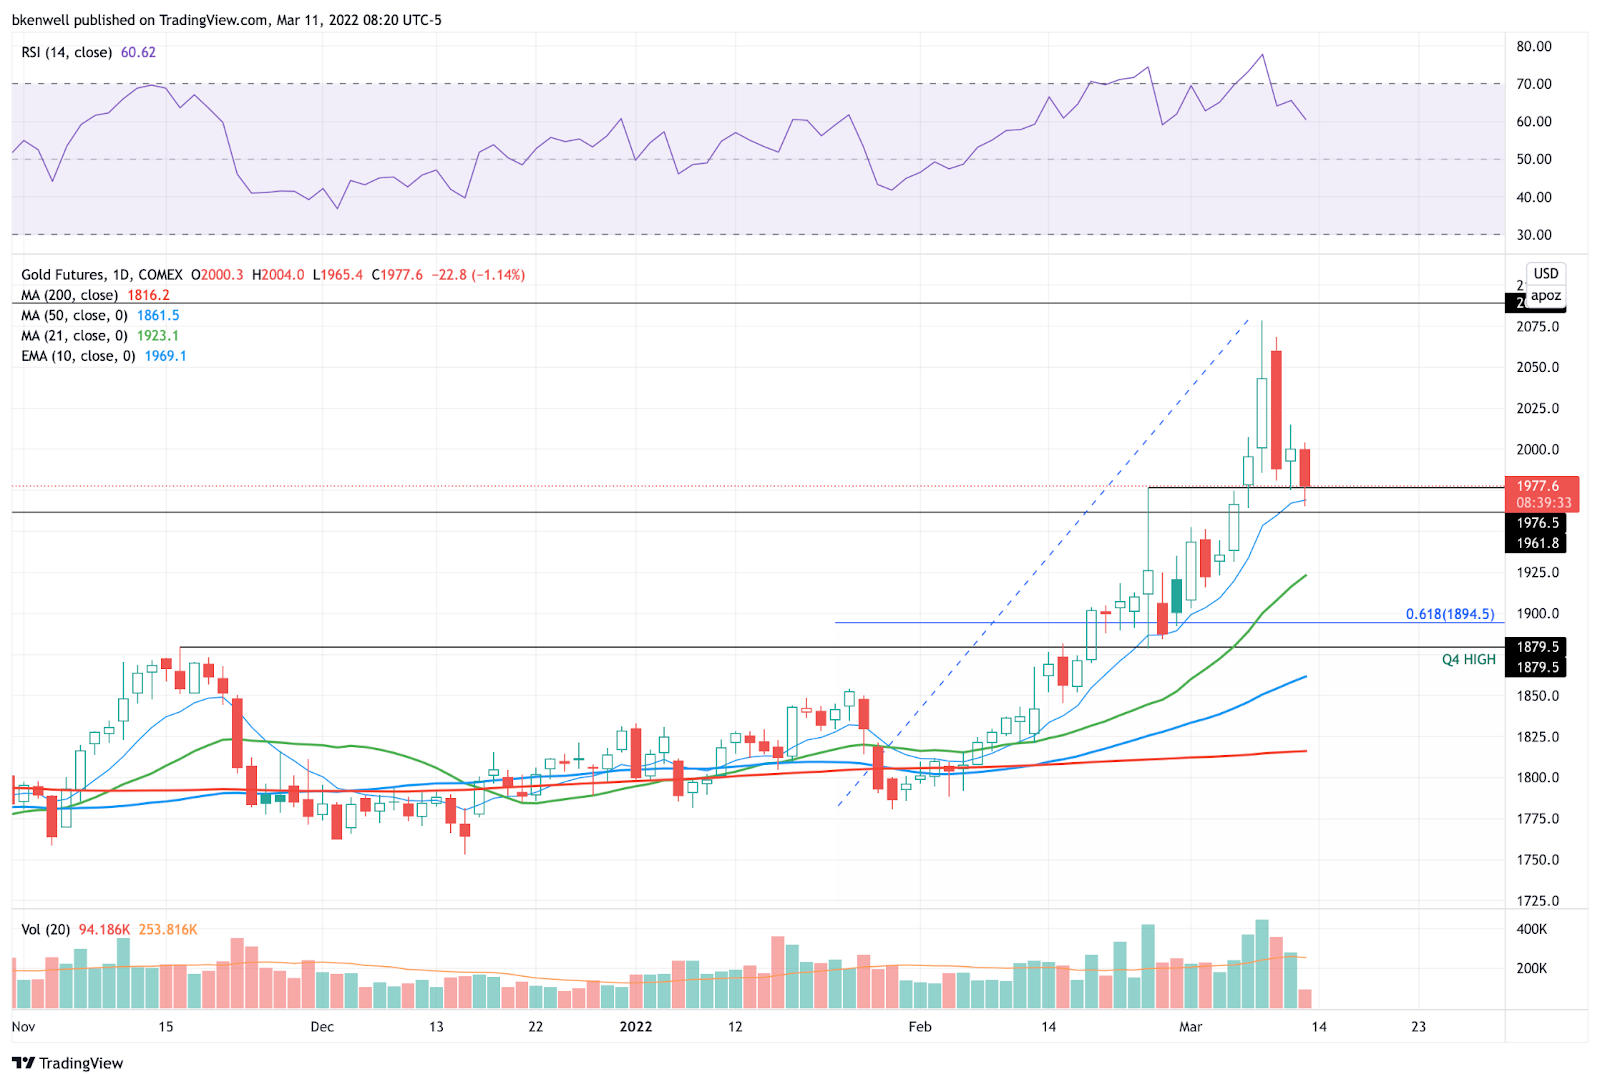
Another #KISS setup on a volatile name. Gold continues to hold active support for us, between $1961 and $1975, along with the 10-day ema.
So far, buying dips to this area have paid off well. However, if we get tactical, one could say that below $1975 keeps the door open to the 10-day and the overnight low.
Below $1961 and we could be looking at $1950 or lower.
VRTX

At one point last month, I had VRTX earmarked as a short. Now that it’s stabilized, I can’t help but notice how many times it’s bumping its head against the 2021 high at ~$243.
I don’t like buying breakouts/rotations in this tape, but as BTU proved yesterday, it can be quite profitable to do so (noted below on the watch list).
Over $243 is a multi-day and a weekly-up rotation. If it sticks, we could be looking at $250 next.
AMZN

I would love to see AMZN rotate higher and clear $3,000 going into the weekend. Just be leery of a fade.
It’s trading just above yesterday’s high in the premarket now. A break to the downside could trigger a bearish reversal. That could be a “cute” short if the market rolls over early, even if just for a quick cash-flow trade.
Go-To Watch List
*Feel free to build your own trades off these relative strength leaders*
Numbered are the ones I’m watching most closely.
- TU — Tight chart and daily up over $26.20
- TECK — beauty thus far. Trim ½ & look for $44.25 on the rest.
- Energy —XLE, APA, CNQ, CVX, ENB | b/e stop on these.
- Boring but Good: BRK.B, KHC, MKC
- ABBV, BMY
- Gold, GDX
- FCX
- ADM — looking to buy near $80
- Defense — RTX, GD, LMT, NOC
- CHKP — $140+ Daily-up rotation
- UPST
- COOP
- AR
- COST, DLTR, BBY
- BTU — Huge winner off that Daily-up move. Definitely trim. I am down to ⅓ already.
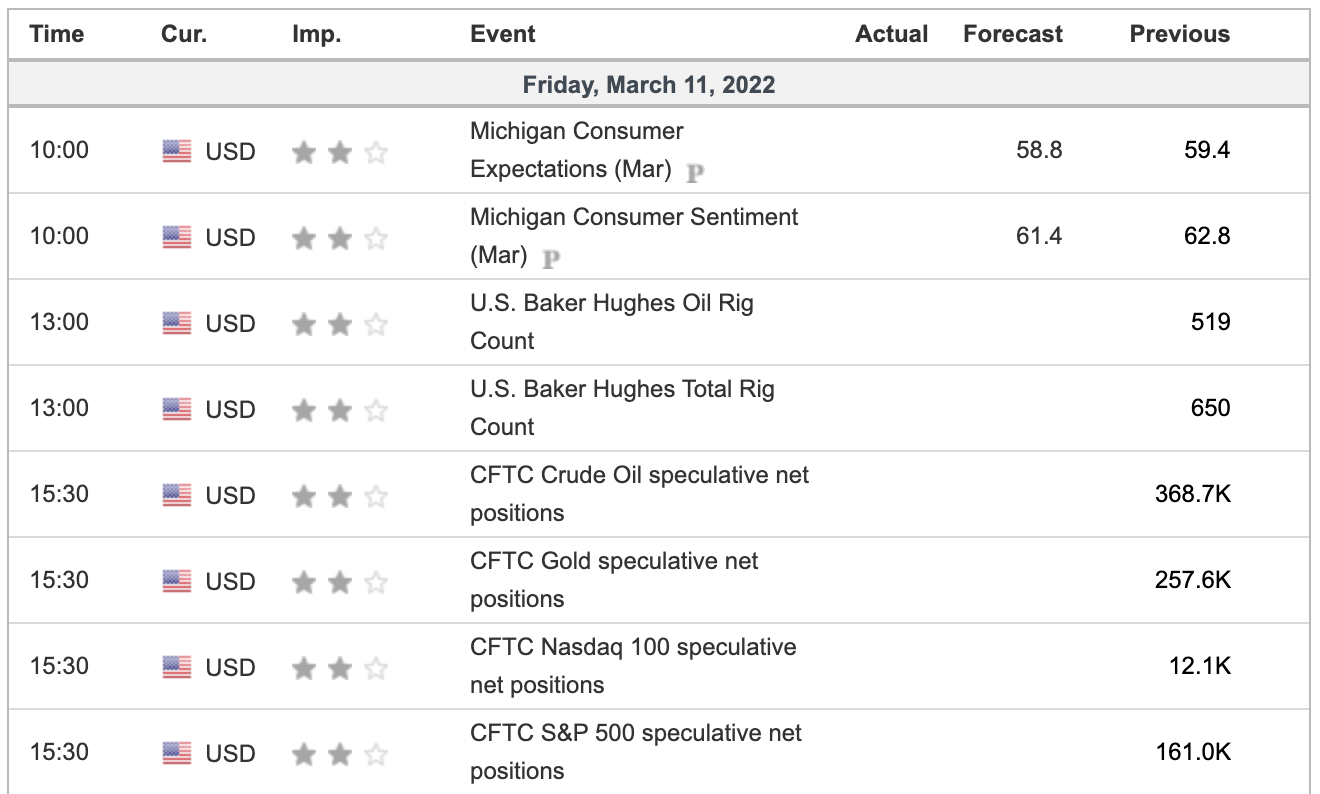
Economic Outlook
Comments are closed