Danny’s View: The Opening Print Recap
The ES traded up to 4659 on Globex just before Friday’s open. After opening at 4656.25, the ES traded up to 4659 in the opening minute but dropped to 4645.75 at 9:40, a quick ~13 handle dip.
After resetting on Wednesday, we had a tepid bounce — AKA a flat day or what we called a “no day” on Thursday — and the ES was now struggling on Friday morning. It then traded back up to the VWAP at 4656.50 (near the opening price) and then back-and-filled in a 6-to 7-point range for the next 40 minutes.
After another small pullback, the ES rallied up to a new high at 4665.25, pulled back a few points, and then ran up to 4678.50 at 12:03, up almost 33 points off the low and almost 35 points off the Globex low. The pop was a combination of three things: Small buy programs, short-covering, and buy stops.
After putting in a few lower highs, several sell imbalances showed up that pushed the ES down 9.75 points to 4668.75. Just before 2:00, several buy imbalances started showing up, which pushed the ES back up to the 4675 level.
The ES sold back down to 4667.25 at 3:36 and that drop is what set up a 16.25 point rally up to 4683.50, up almost 38 points from the day-session low.
On the 4:00 cash close, the ES traded 4678.75 and after 4:00, the ES traded up to a new high at 4685.50 at 4:36. It went on to settle at 4681 on the 5:00 futures close, up 34.50 points or 0.74% on the day.
In the End
Everything pointed to a ‘thin to win’ rip. In terms of the ES’s overall tone, both the NQ and ES shook off the after-the-open selloff and closed firm. In terms of the ES’s overall trade, volume was low. 1.156 million ES contracts traded on the day, slightly below the 20-day average.
Our View
In the next few days, I am going to talk about the next big ‘melt up’ period, and guess what? It’s well beyond ES 4700. Right now I am looking at the ES on Globex and it’s up 10 points. Once the ball got rolling Friday, there was no stopping it on the 4:00 cash close and so far tonight, it’s putting on a pretty good showing.
I am not sure the short sellers are convinced but a close above 4698 points to 4760. I know there are a host of negatives facing the S&P, but I don’t think we see anything really bad happen. The Fed is still buying bonds, inflation is raging and it’s business as usual for the bulls.
As of Friday’s close, Tesla’s Elon Musk has sold $6.9 billion in stock. He reported selling 1.2 million shares on Friday, worth more than $1.2 billion, according to a regulatory filing made public late Friday. As you can see, the stock is still under selling pressure, and if Musk is true to his word he has another 4% of his planned 10% stake to sell.
Our Lean
I think the big thing this week is the earnings.
On Tuesday morning we will hear from Walmart and Home Depot. On Wednesday we have Target and Lowe’s before the open, while Nvidia and Cisco report after the close. On Thursday morning, Alibaba and JD.com report alongside Macy’s and Kohls. AMAT, INTU, PALO, and WDAY report after the close.
In other words, it’s a few notable tech plays, an update on Chinese e-commerce, and a ton of retail reports.
Our Lean: Sell the early rallies and buy the pullbacks. As bullish as everyone seemingly became on Friday afternoon, keep in mind that the trend over the last week was to sell the early rallies in the ES. With stocks now back in bull-mode, it’s likely that these morning dips are opportunities. Further, it’s Opex week and that can create some false starts early in the week as they burn up option premiums.
Like I said earlier, I am still working on when I think the ES accelerates higher and should be done with the study in the next few days. Lastly, despite my 2020 year-end call for ES 4700 — and completing it — I want to take a guided approach to ES 5000.
I’m old school though and I want to see 4760 before I start talking about 5000.
As we all know, there’s no crystal ball when it comes to trading stocks, options, or futures. But the Market Imbalance Meter may be as close as it comes. Knowing how the “Big Money” is placing its bets can give our trading room a big wave to ride — or a warning sign to stay out of the water. Come check it out now, risk-free for 30 days.
Technical Breakdown — A Much Needed Refresh
In a word, the last two-day sequence has played out incredibly well. After a monstrous run off the October lows, the Mr. Top Step team was looking for a few days of rest. The move was simply unsustainable and for those looking for a strong finish to the year, they knew we needed a rest.
On Wednesday we had the reset move to the 8/10-day moving averages. Thursday didn’t quite result in the rally many were looking for, but we had to be patient and remember that it was Veterans Day, which resulted in a bank and bonds holiday — AKA it was a sluggish day in the equities market.
Friday was the follow-through day and now bulls are firmly back in control. In other words, we’re aligning with the long side until proven otherwise. What gets us there?

We would turn less bullish if the ES and the NQ were to go weekly down. For the ES (which is the chart above), that means a drop below 4625. For the NQ (below), that’s a move below 15,896.
For non-futures traders, this logic can simply be applied to the SPY or SPX, and the QQQ or the Nasdaq.
You’ll notice that both charts are weekly views and in both scenarios, the ES and the NQ have provided us with inside weeks. That means any sort of rotation on a weekly basis — either a weekly-up through last week’s high or a weekly-down move through last week’s low — could very well accelerate the move in that direction.
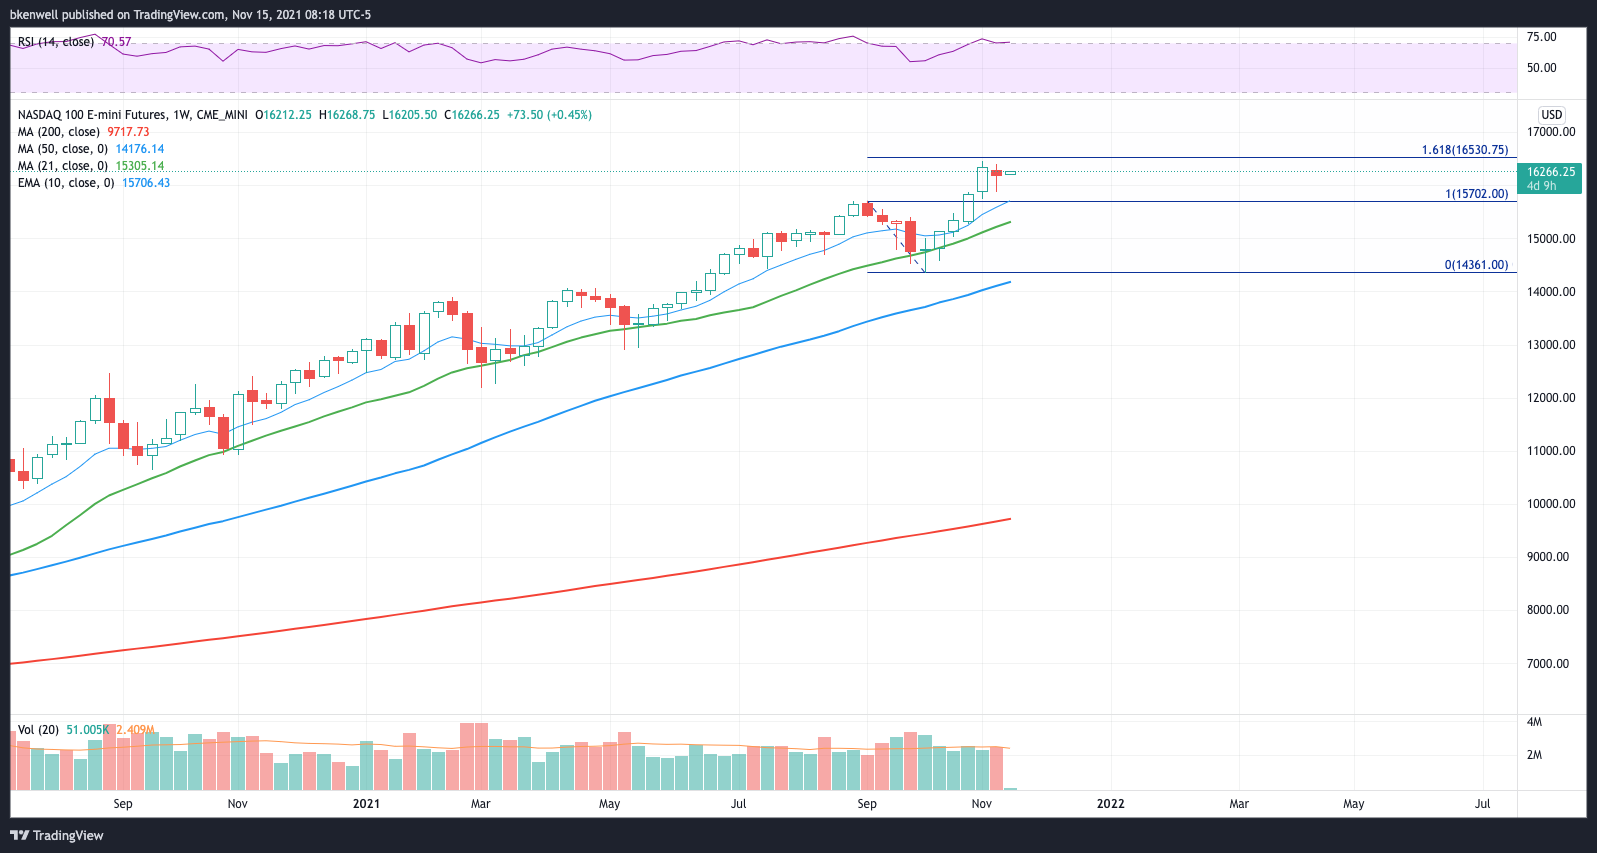
At this point, the bulls would love a weekly-up rotation in both indices. If we get it in the ES, that puts the 4725 to 4730 area in play.
For the NQ, it opens the door to the 16,500 to 16,550 zone.
If these targets hit, we’ll need to reassess both indices.
As for individual stocks, we will continue to manage some of the rotations that triggered late last week, such as GOOGL, MSFT, ICE and RBLX.
In particular, GOOGL produced a robust lotto play that was good for 10X+. RBLX gave us a 7.5% one-day gain from the daily-up trigger and is currently ahead by almost 2% in pre-market trading. Let’s see how they play out while keeping a firm view of the indices in mind.
Disclaimer: Charts and analyses are for discussion and education purposes only. I am not a financial advisor, do not give financial advice and am not recommending the buying or selling of any security.
Remember: Not all setups will trigger. Not all setups will be profitable. Not all setups should be taken. These are simply the setups that I have put together for years on my own and what I watch as part of my own “game plan” coming into each day. Good luck!
Comments are closed