Down 3 Days in a Row; Jobs Report Tomorrow
Can we find a short-term low?
Follow @MrTopStep on Twitter and please share if you find our work valuable!
Our View
The ES has now sold off 100 points from its December 4841.75 contract high, while the NQ is off more than 675 points from its recent high.
Is that enough? It could be in the near term, but I don’t think the low is in for January. As for the Fed, I am not surprised at all.
There was too much irrational exuberance between the markets going up and the big bets on interest rates going down. For a quick refresh, last month the Fed said it expects about 75 bps of rate cuts in 2024. However, the market is pricing in about 150 bps worth of cuts.
There is just too much time in the year to throw your hat in one direction. Today’s economic calendar includes the ADP number, initial jobless claims, and the S&P MPI services number and tomorrow is the week one FRYdays options expiration and the December Jobs report.
That all said, the S&P is headed for its first down week in 10 weeks — so keep that in mind when it comes to the trend.
Our Lean
Big or small, the bounces have been failing and the ES is now down three days in a row and down 100 pts off its all-time high. The selling in the Nasdaq that started last Wednesday and continued into Tuesday and Wednesday has been an extremely large rebalance out of the tech sector.
The trading rule from Stock Trader’s Almanac is that the first 5 sessions of the year sometimes dictate the direction of the year. I think it’s too early to say how 2024 is going to end up, but like I have said, the ES is overdue for a pullback. It needs to establish a trading range and get ready for a lot of ups and downs in the first quarter. Don’t forget, earnings will start soon too.
Our Lean is the markets act like crap right now, but are down three in a row and going into Friday’s options expiration. The rule is to start looking for the Thursday / Friday low for a bounce.
Sometimes it comes late on Thursdays and sometimes it comes on a gap-down open after the jobs report. Our lean: the 4740 level is a key area. Should the ES gap down this morning, my lean would be to buy the open or the first pullback after the gap down and look to sell the rallies — especially if the NQ is weak again. That’s more for a scalp, but the idea is to look for a low and then a rip into Friday expiration.
For those of you who like HandelStats levels, here they are:
-
Upside: Trade and hourly close above 4742.25 targets settlement at 4746.5, above there targets 4750.50, then -1sd weekly at 4756.20. Hourly close above there targets 4767. Hourly close above there targets 1sd at 4774.38. Trade and hourly close above 4775.12 targets 4783.25, hourly close above there targets 4799.88** then 2sd at 4802.25. Hourly close above there targets 4820.75.
-
Downside: Hourly close below 4742.25 targets 4726.88, hourly close below there targets -1sd at 4718.62. Hourly close below there targets 4701.75 then -2 sd weekly at 4698.91. Hourly close below there targets 4691.62, -2sd at 4690.75. Hourly close below there targets 4683.50, then 4679.75. Hourly close below there targets 4668.38, then -3sd at 4662.87.
MiM and Daily Recap

ES 15-min recap
The ES struggled after Tuesday’s late rip and sold off down to 4762.25, down 26.25 points, opening Wednesday’s regular session at 4764.50. After the open, the ES traded 4765.25 and then sold off down to 4756.00 at 9:59, rallied back up to 4767.75, dropped back down to a higher low at 4757.75, and then rallied up to a new high at 4769.50 at 10:06. From there, the ES made a beeline down to a new low at 4546.50 at 10:47, rallied up to 4658.00 at 11:04, back-and-filled for the next 32 minutes, then sold back off down to a higher low at 4749.00 at 12:45 and then rallied up to 4767.50 at 1:02.
After the rally, the ES sold off down to 4748.75 after the Fed said it had no timetable for when it was going to lower rates. The ES rallied up to a 4771.75 high at 2:22 and then sold back off down to the 4748.25 at 3:47 level and traded 4748.75 as the 3:50 cash imbalance showed $2.4 billion to buy and sold off to a new daily low at 4741.00 at 3:56. The ES traded 4747.50 on the 4:00 cash close, then chopped around in a 4-point range and settled at 4738.75 on the 5:00 cash close, down 39.75 points or 0.83% on the day.
In the end, no one promised us a rose garden. In terms of the ES’s overall tone, the ES continues to follow the weak leader, tech stocks. In terms of the ES’s trade, volume was higher, 231k traded on Globex, and 1.357 traded on the day session for a total of 1.588 million contracts traded.
Technical Edge
-
NYSE Breadth: 25% Upside Volume
-
Nasdaq Breadth: 21% Upside Volume
-
Advance/Decline: 29% Advance
-
VIX: ~14
ES
Levels from HandelStats.com

ES Daily
-
Upside: Trade and hourly close above 4742.25 targets settlement at 4746.5, above there targets 4750.50, then -1sd weekly at 4756.20. Hourly close above there targets 4767. Hourly close above there targets 1sd at 4774.38. Trade and hourly close above 4775.12 targets 4783.25, hourly close above there targets 4799.88** then 2sd at 4802.25. Hourly close above there targets 4820.75.
-
Downside: Hourly close below 4742.25 targets 4726.88, hourly close below there targets -1sd at 4718.62. Hourly close below there targets 4701.75 then -2 sd weekly at 4698.91. Hourly close below there targets 4691.62, -2sd at 4690.75. Hourly close below there targets 4683.50, then 4679.75. Hourly close below there targets 4668.38, then -3sd at 4662.87.
NQ
NQ Daily
-
Upside: Hourly close above 16492 targets 16519.25, then settlement at 16537.75, then 16549. Hourly close above 16549 targets 16608.35 and 16609.25. Hourly close above there targets 16621.75, then 16652.12. Hourly close above 16652.12 targets 1sd at 16684.65, then 16695. Hourly close above there targets 16823.50, 2sd at 16831.54.
-
Downside: Hourly close below 16492 targets 16469.25. Hourly close below there targets -1sd at 16390.85. Hourly close below there targets 16366.12, hourly close below there targets -2 sd weekly at 16300.65. Below there 16289.75, hourly close below there targets 16276.38, then 16263. Hourly close below 16263 targets -2 sd at 16243.96. Hourly close below there targets 16197. Hourly close below there targets -3sd at 16097.06.
Guest Post
PTG / Taylor 3 Day Cycle
Author: David D Dube’ (a.k.a. PTGDavid) — Website
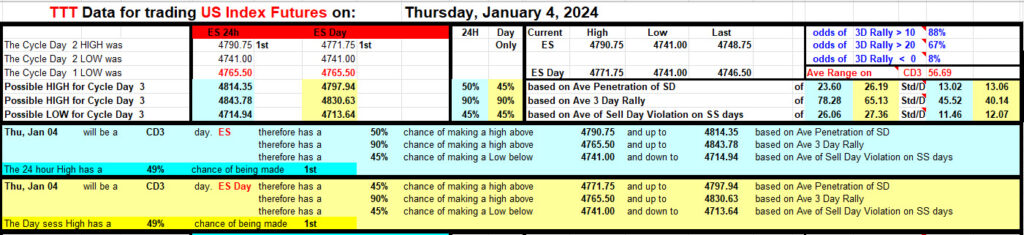
Prior Session was Cycle Day 2 (CD2): Markets continued their decline, pushing down to the 12/20/23 lows and fulfilling Cycle Day 2 Violation Level (4747). Prior range was 49 handles on 1.587M contracts exchanged.
…Transition from Cycle Day 2 to Cycle Day 3
This leads us into Cycle Day 3 (CD3): Price is currently below Cycle Day 1 Low (4765.50) with historical odds of recovering this level during today’s session. Should price fail to reclaim this level, then Cycle will be marked as “failed”, which historically only occurs 9% of the cycle tracking, extending over 12 years. Failed cycles are signals for potential investor/trader sentiment shift, which could portend extended market weakness. As such, scenarios to consider for today’s trading.
Bull Scenario: Price sustains a bid above 4750, initially targets 4765 – 4770 zone.
Bear Scenario: Price sustains an offer below 4750, initially targets 4730 – 4725 zone.
PVA High Edge = 4767 PVA Low Edge = 4750 Prior POC = 4756
*****The 3 Day Cycle has a 91% probability of fulfilling Positive Cycle Statistics covering 12 years of recorded tracking history.
For more detailed information for both bullish and bearish projected targets, please visit: PTG 3 Day Cycle and/or reference the Cycle Spreadsheet below:
Link to access full Cycle Spreadsheet > > Cycle Day 3 (CD3)
Thanks for reading,
PTGDavid
Economic Calendar

Comments are closed