End of the Year Rebalances: Sell Stocks, Buy Bonds
Follow @MrTopStep on Twitter and please share if you find our work valuable!
Our View
Unlike most trading days over the last 8+ weeks, there was definitely two-way price action on Wednesday. That can be attributed to the end-of-the-year rebalance.
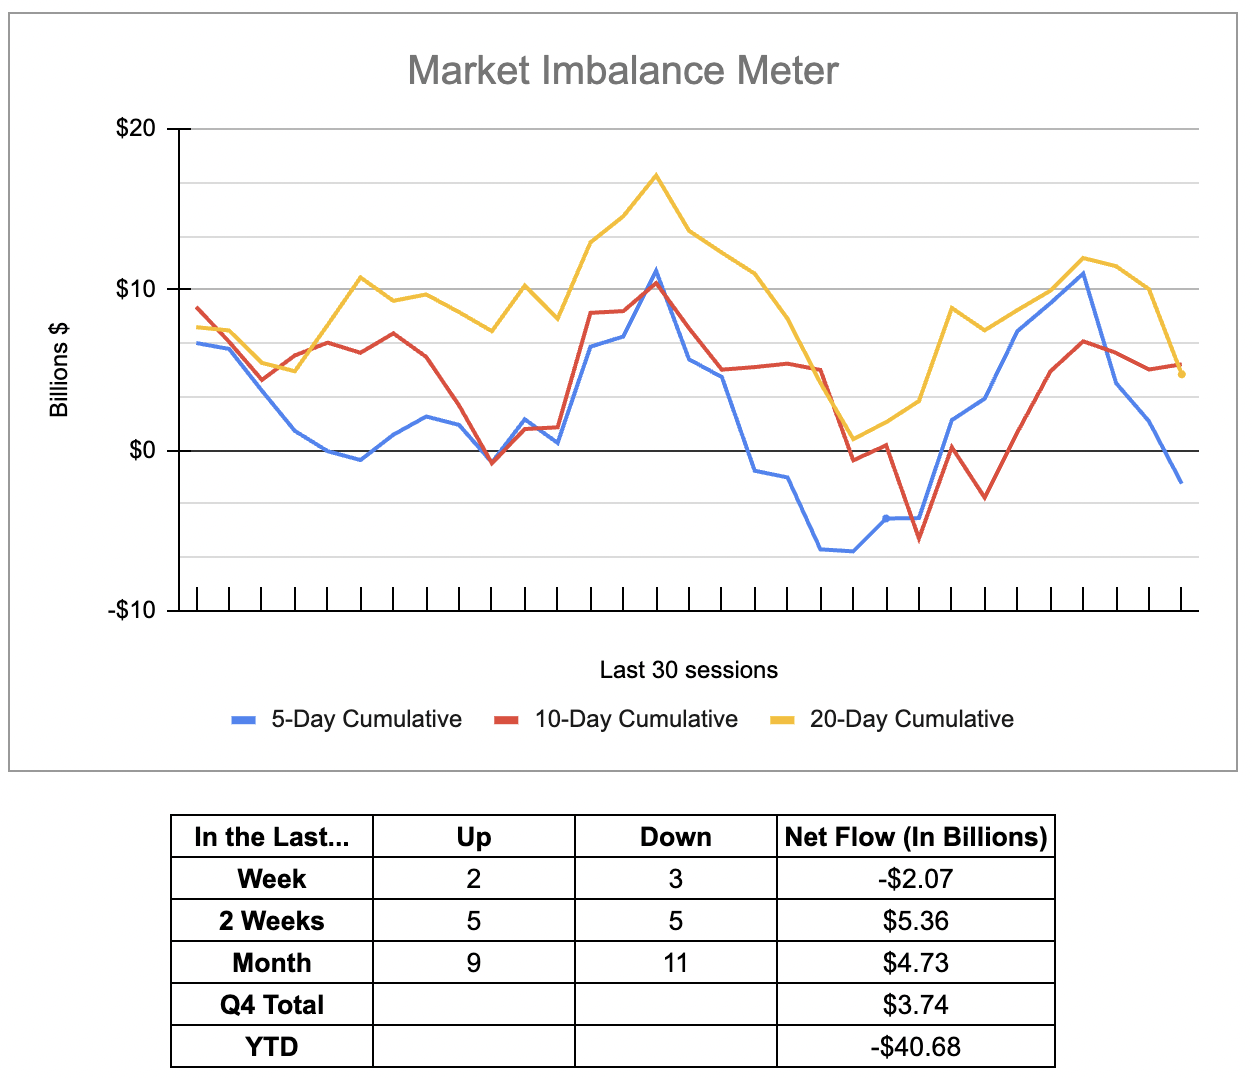
In the last two sessions, the NYSE imbalances have sold $5 billion, while the bonds traded up to 125.30, up more than 18 points (or 17.5%) from its October 23rd low. Had the ES not rallied 12 points after the cash close, both markets would have closed in the direction of the end of the year rebalance: buy bonds/sell stocks.
I found this note from Goldman Sachs newsworthy:
The case for taking more investment risk in 2024
Against a friendlier macro backdrop, the case for adding more risk to investment portfolios may be rising. “The business cycle in general is supportive,” says Goldman Sachs Research’s Christian Mueller-Glissmann on Goldman Sachs Exchanges. “We want to be invested going into next year. We’re neutral equities, neutral bonds, and we’ve downgraded cash from an overweight. And so to some extent, we’re going back to a 60/40 portfolio.”
And while stocks have moved higher in recent weeks, investors should use any market setbacks to buy more equities. “One of the reasons why we said it’s time to be invested next year is also that we expect lower risks from multi-asset portfolios, because you actually have more diversification,” Mueller-Glissmann says.
From an asset allocation perspective, Goldman Sachs Asset Management’s Alexandra Wilson-Elizondo is recommending that investors stay invested in stocks and be long on government bonds, but be cautious on corporate bonds. “Inflation coming down and moderate levels of growth are good for equity markets,” says Wilson-Elizondo. “And typically, going into a Fed cutting cycle, large-cap equities do quite well.”
Our Lean
There are billions worth of bonds and stocks that will change hands over the next few days as institutions buy bonds and sell stocks at the end of the year. A few people on Twitter asked me why the ES rallies in the final minutes of the day after big NYSE 3:50 ET sell imbalances showed up.
The reason is, the funds sold losing stock positions at 3:50 and then marked up the winning stocks on the 4:00 cash close. This type of price action is part of the “end of the year rebalancing” — which should persist right into the end of Friday’s final trading session of the year.
Our Lean is still to buy the pullbacks today and for FRYday, but I also can’t rule out some type of “end of the year walk-away” trade. Also beware of the late gamma trade today and tomorrow.
For those of you who like HandelStats levels, here they are:
-
Upside: Trade above 4833.75 targets 4836.25, then 4838.75, then 4841.24. Hourly close above 4841.24 targets weekly 1 sd and 1 sd at 4861.17 and 4861.55. Hourly close above there targets 2 sd at 4887.59, hourly close above there targets 3 sd at 4914.
-
Downside: Trade below 4833.75 targets 4832. Hourly close below there targets 4825.50. Hourly close below there targets 4811.25, then -1 sd at 4808.13. Hourly close below there targets 4794.62 and 4794.00, then 4790. Hourly close below 4790 targets -2 sd at 4781.91. Hourly close below there targets 4777.62, then 4774.25, hourly close below there targets 4765 then 4763.25, hourly close below there targets -3 sd at 4755.49.
MiM and Daily Recap
ES Recap
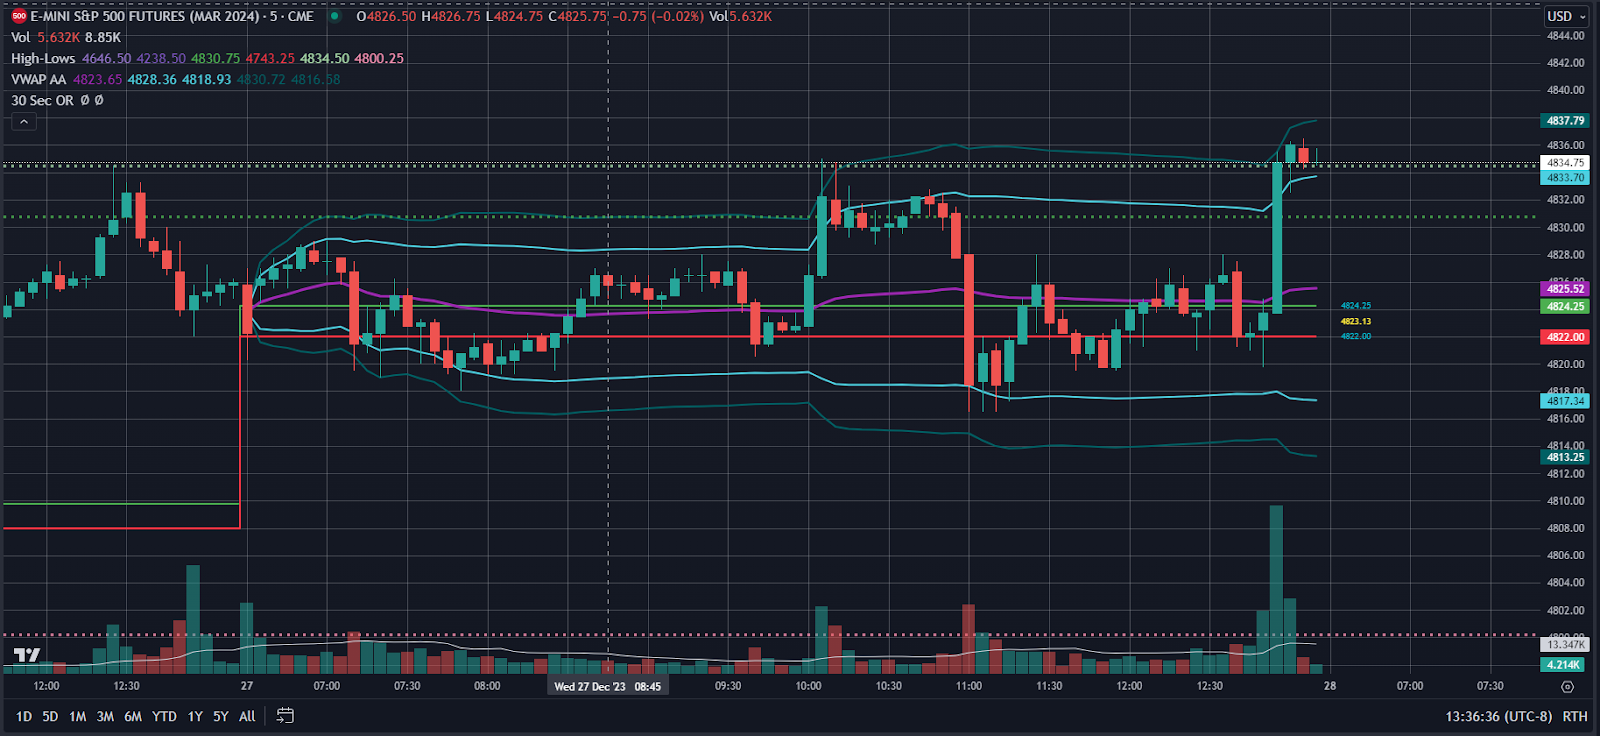
The ES traded up to 4830.00 on Globex and opened Wednesday’s regular session at 4822.25. After the open, the ES rallied up to 4829.00 at 10:07, sold off 11 points down to 4818.88 at 10:55, and then rallied 17 points up to 4835.00 at 1:06. After the high, the ES back-and-filled in a 4 to 6-point range until the ES dropped down to a 4816.50 double bottom at 2:11, rallied back up to 4518.00 at 2:27, and pulled back down to the 4819.50 at 2:58.
The ES traded back up to 4828.00 at 3:37 as the early NYSE imbalance showed $64 million to buy and then sold back off down to the 4821.00 level at 3:45 and traded 4822.50 as the final 3:50 cash imbalance showed $1.9 billion to sell to and traded 4834.75 on the 4:00 cash close. After 4:00, the ES traded up to 4836.50 at 4:14 and settled at 4834.75 on the 5:00 futures close, up 7.75 points or 0.16% on the day.
In the end, part of the end-of-the-year rebalance showed up yesterday, buying bonds and selling stocks. In terms of the ES’s overall tone, it’s ridiculously overbought. In terms of the ES’s overall trade, volume was higher than Tuesday, but still low: 116k traded on Globex and 834k traded on the day session for a total of 950k contracts traded.
Technical Edge
-
NYSE Breadth: 56% Upside Volume
-
Nasdaq Breadth: 84% Upside Volume (!)
-
Back-to-back 80%+ upside days
-
-
Advance/Decline: 60% Advance
-
VIX: ~12.50
ES
Levels from HandelStats.com
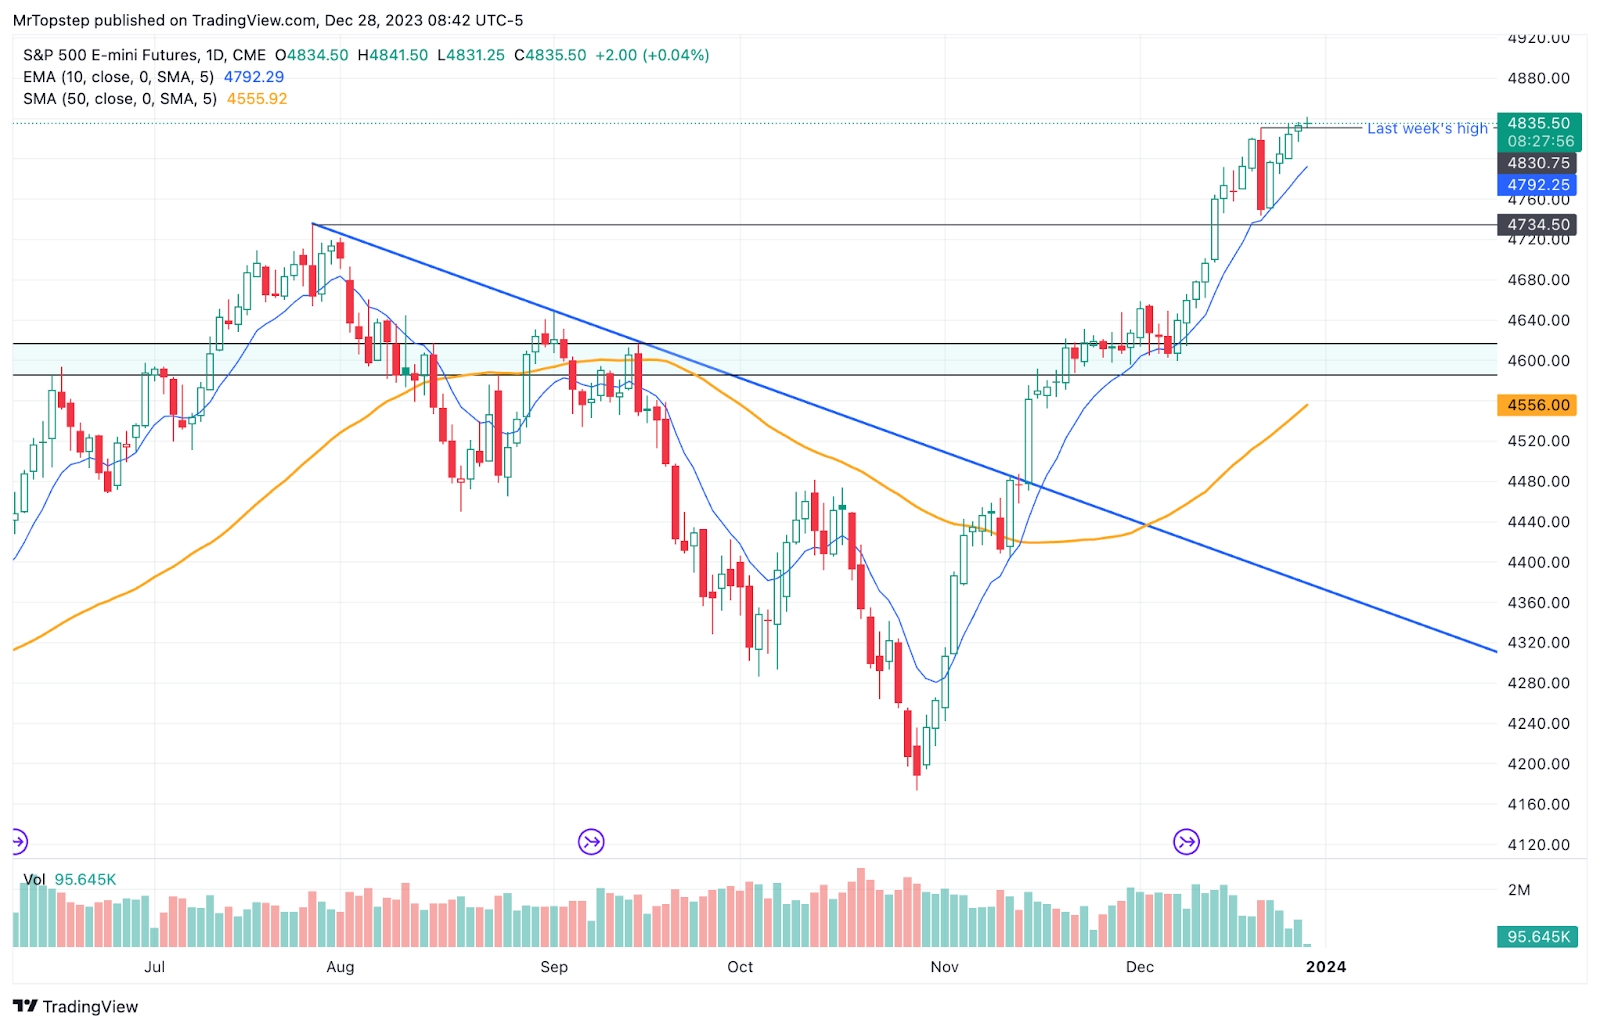
ES daily
-
Upside: Trade above 4833.75 targets 4836.25, then 4838.75, then 4841.24. Hourly close above 4841.24 targets weekly 1 sd and 1 sd at 4861.17 and 4861.55. Hourly close above there targets 2 sd at 4887.59, hourly close above there targets 3 sd at 4914.
-
Downside: Trade below 4833.75 targets 4832. Hourly close below there targets 4825.50. Hourly close below there targets 4811.25, then -1 sd at 4808.13. Hourly close below there targets 4794.62 and 4794.00, then 4790. Hourly close below 4790 targets -2 sd at 4781.91. Hourly close below there targets 4777.62, then 4774.25, hourly close below there targets 4765 then 4763.25, hourly close below there targets -3 sd at 4755.49.
NQ
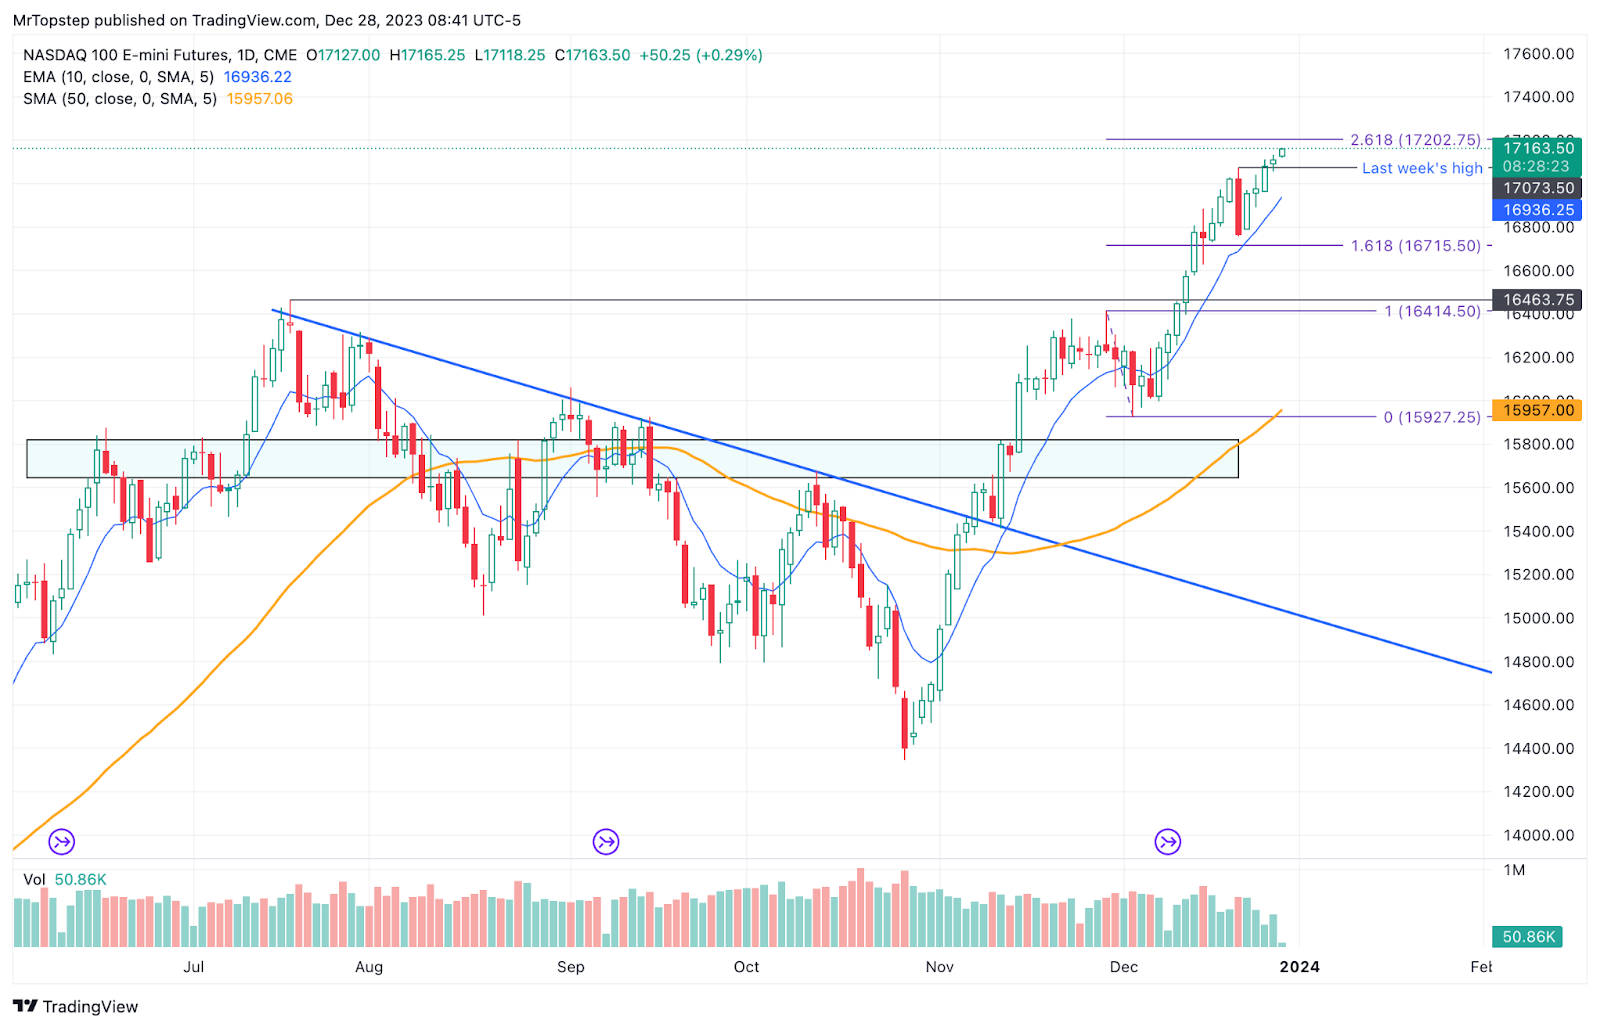
NQ Daily
-
Upside: Trade and hourly close above 17153.75 targets 1sd at 17271.88. Trade and hourly close above there targets weekly 1sd at 17302.80 and 17304.75. trade and hourly close above there targets 2sd at 17416.84. Hourly close above there targets 17525.35 ****(Major target), then 3sd at 17561.89.
-
Downside: Trade and hourly close below 17153.75 targets 17147.62, then 17141.50, hourly close below there targets settlement at 17126.75, then 17112. Hourly close below 17112 targets 17088.2, hourly close below there targets 17052.12, hourly close below there targets 17015.26, hourly close below there targets -1sd at 16981.70.
-
Hourly close below there targets 16946.25 then 16937.75. Hourly close below there targets 16913, then 16901.75, hourly close below there targets 16883. then 16875.50, hourly close below there targets -2 sd at 16836.66. Hourly close below -2 sd targets 16803.25. Hourly close below there targets 16740.50, hourly close below there targets -3sd at 16691.61.
-
Guest Post
PTG / Taylor 3 Day Cycle
Author: David D Dube’ (a.k.a. PTGDavid)
Website: https://polaristradinggroup.com/
Prior Session was Cycle Day 1 (CD1): This session did produce a relatively shallow decline as price held Line-in-Sand (LIS) 4820 on pullback and also fulfilled initial upside target (4835) as outlined in prior DTS 12.27.23 briefing. Prior range was 20 handles on 949k contracts exchanged.
…Transition from Cycle Day 1 to Cycle Day 2
This leads us into Cycle Day 2 (CD2): Santa Claus Rally continues to hold firm as we enter the final two trading days of 2023. Low volumes (thin to win) are supportive of new highs into final trading hours on Friday. As we noted in prior briefing...“This is definitely NOT the time to be playing “catch-up” performance. Stay disciplined and in-alignment with intra-day forces. NO HEROES!” As such, scenarios to consider for today’s trading.
Bull Scenario: Price sustains a bid above 4830, initially targets 4845 – 4852 zone.
Bear Scenario: Price sustains an offer below 4830, initially targets 4820 – 4815 zone.
PVA High Edge = 4827 PVA Low Edge = 4820 Prior POC = 4826
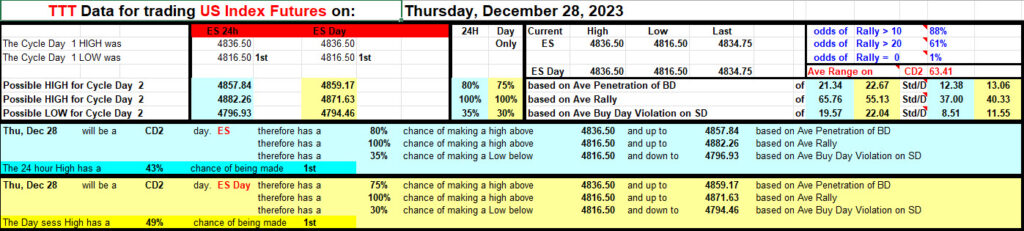
*****The 3 Day Cycle has a 91% probability of fulfilling Positive Cycle Statistics covering 12 years of recorded tracking history.
For more detailed information for both bullish and bearish projected targets, please visit: PTG 3 Day Cycle and/or reference the Cycle Spreadsheet below:
Link to access full Cycle Spreadsheet > > Cycle Day 2 (CD2)
Thanks for reading,
PTG David
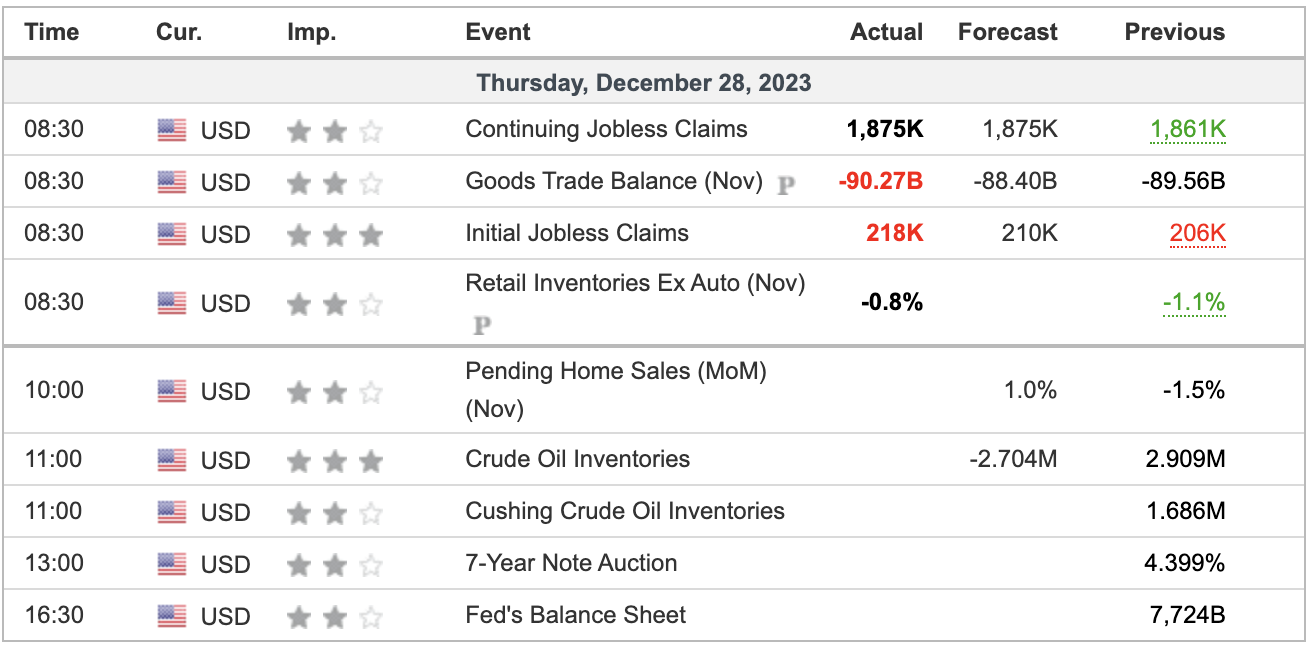
Economic Calendar
Comments are closed