Fed’s Rate Decision in Full Focus
Bulls still have the edge.
Follow @MrTopStep on Twitter and please share if you find our work valuable!
Our View
There is so much to talk about.
The first part is simple: You know it as ‘thin to win.’ Only 165k ES contracts traded on Globex and 975K on the day session. The PitBull and I have been talking about the low volumes, asking, “where did it go?”
All the little selloff did yesterday was shake out some weak longs and add more shorts to the squeeze. That’s as the ES ratcheted up to 4,956 and inches closer to 5,000.
The second aspect was all the stops above 4,930 — which they ran on their way to 4,950+ yesterday. What a way to start the week, and a busy one at that.
Lastly, all the back-and-fill the ES has been doing is paying off for the bulls.
I also have to mention the January month-end and T+2: Marking down the losers and marking up the winners. Seems to me that with only two sessions left in the month, we still go higher, but I wonder if there is an end-of-the-month walk away. We also have to wonder if they’ll rally the markets in the Fed’s Wednesday afternoon event.
Also, if you didn’t see this, fees from the CME exchange have gone up (and will go into effect on Feb. 1).
Our Lean
Today is day one of the Fed’s two-day meeting and it should also be a low volume grind.
Goldman Sachs says rate cuts need to be on the menu in March. David Mericle, the bank’s chief US economist, said the Fed delaying cuts beyond March could negatively impact the labor market. Meanwhile, market watchers are now almost evenly split on whether the Fed will lower interest rates in March, according to the CME FedWatch Tool.
Our Lean is simple: Buy the early 20 to 30 point pullbacks. I’m sure there will be some rips to sell, but who’s to say we don’t see 5,000 this week?
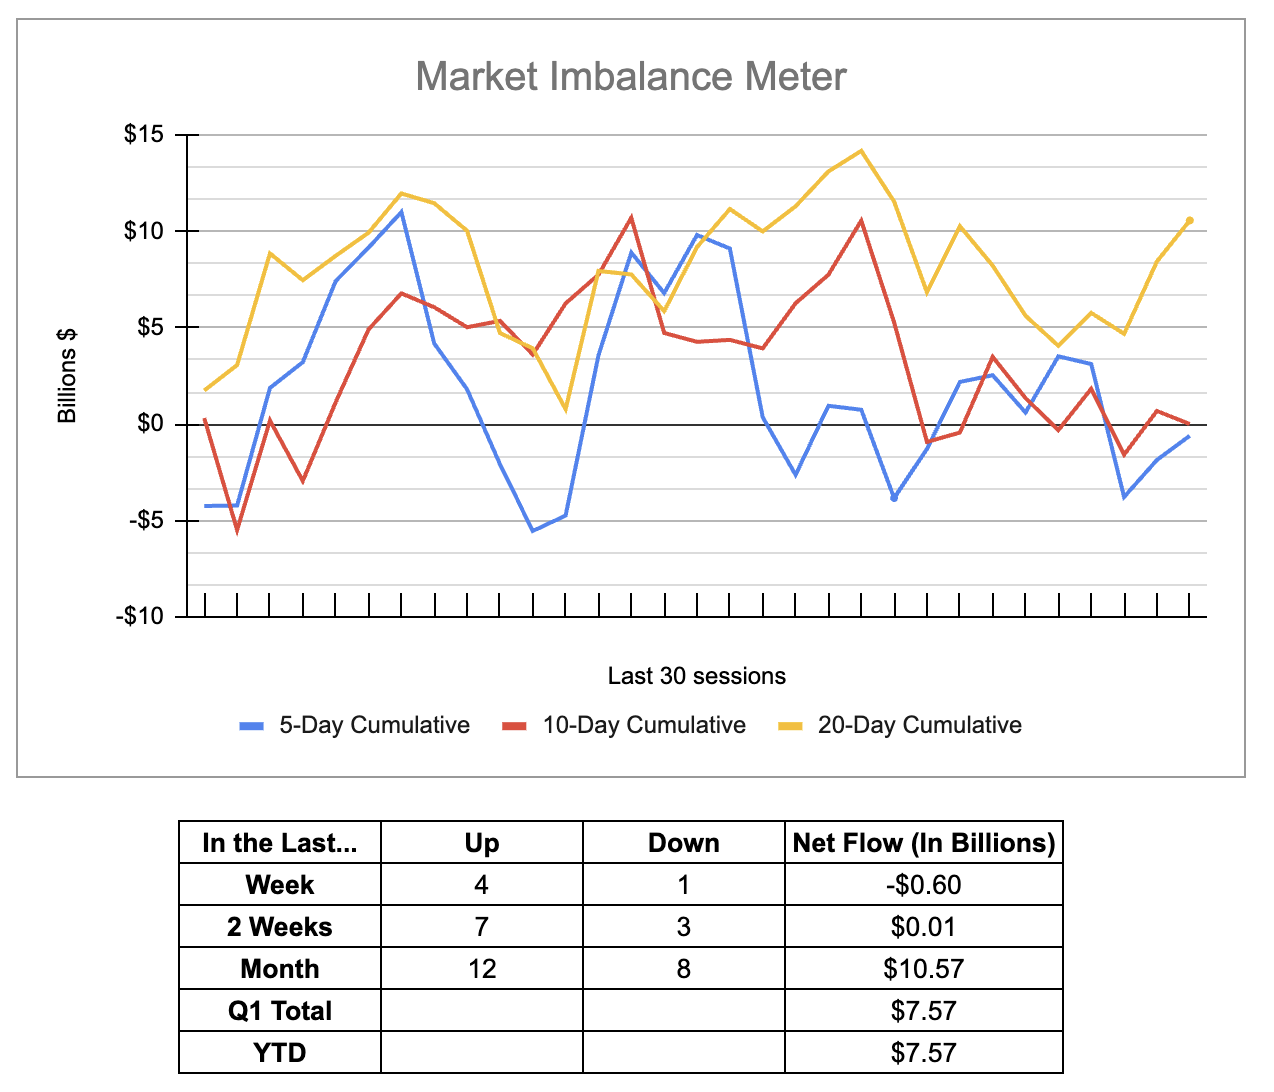
MiM and Daily Recap
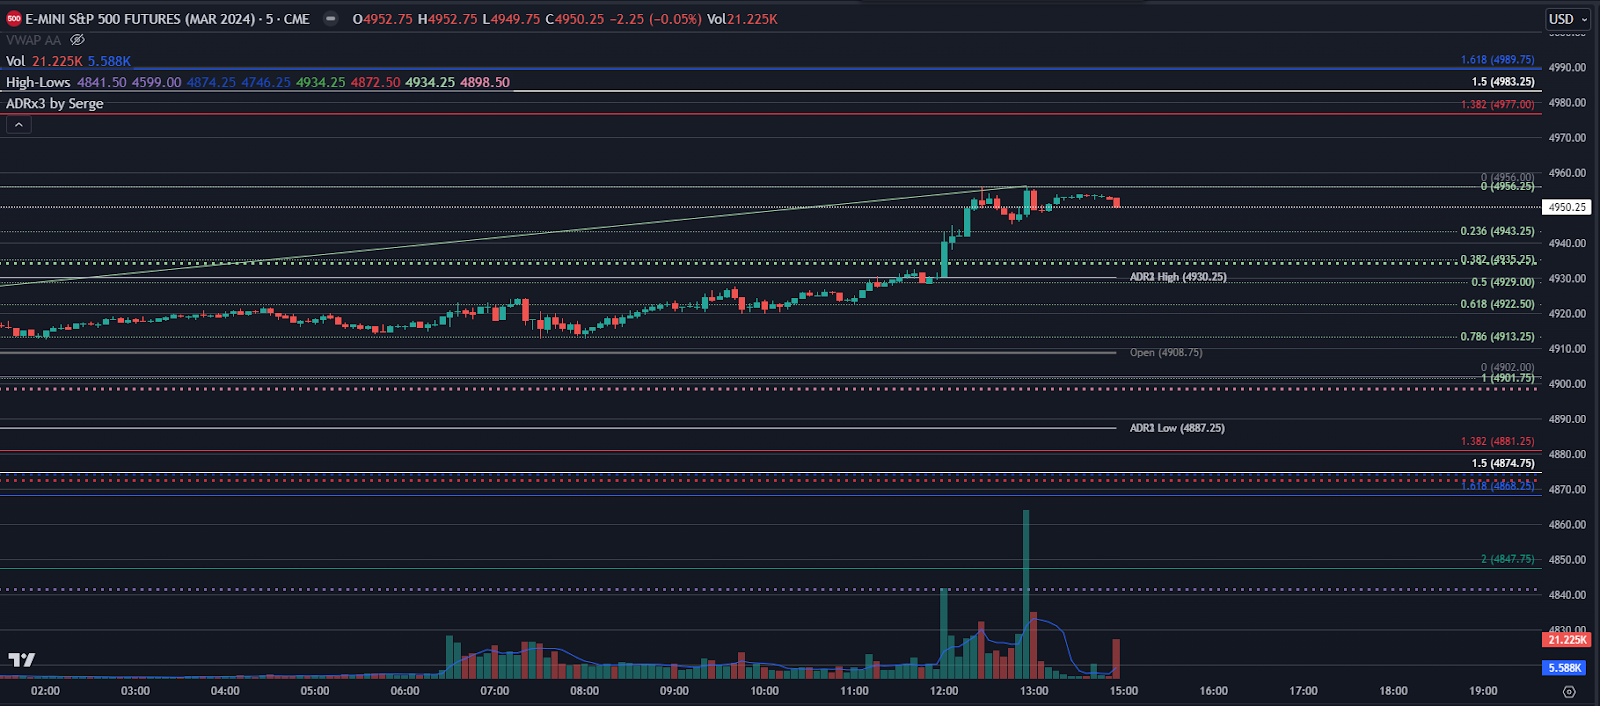
ES recap (15-min)
The ES rallied up to 4921.75 on Globex and traded 4919.00 on Monday’s regular session open. After the open, the ES traded down to 4914.75 and traded up to 4924.25 at 9:40. The ES sold off down to a 4912.75 double bottom at 11:15, and then made 5 separate new highs up to 4932.50 at 2:45. After the high, the ES pulled back to the 4928.50 level and then a big upside stop run hit, pushing the ES up to 4956.00 on heavy volume — 75.6k ES futures traded in one candle, as the early imbalance showed $282 million to buy.
The ES pulled back to 4945.25 at 3:46 and traded 4948.25 as the 3:50 cash imbalance showed $127 million to buy, rallied up to 4952.25 and traded 4954.75 on the 4:00 cash close. After 4:00, the ES rallied a few points up to the 4955.00 level and traded 4950.25 on the 5:00 futures close.
In the end, the ES and NQ had an early pullback and then got hit by a gigantic buy program. In terms of the ES’s overall tone, the NQ led the markets higher. In terms of the ES’s overall trade, 165k ES traded on Globex and 975K traded on the day session for a total of 1.14 million contracts traded.
Technical Edge
-
NYSE Breadth: 68% Upside Volume
-
Nasdaq Breadth: 79% Upside Volume
-
Advance/Decline: 72% Advance
-
VIX: ~13.50
ES
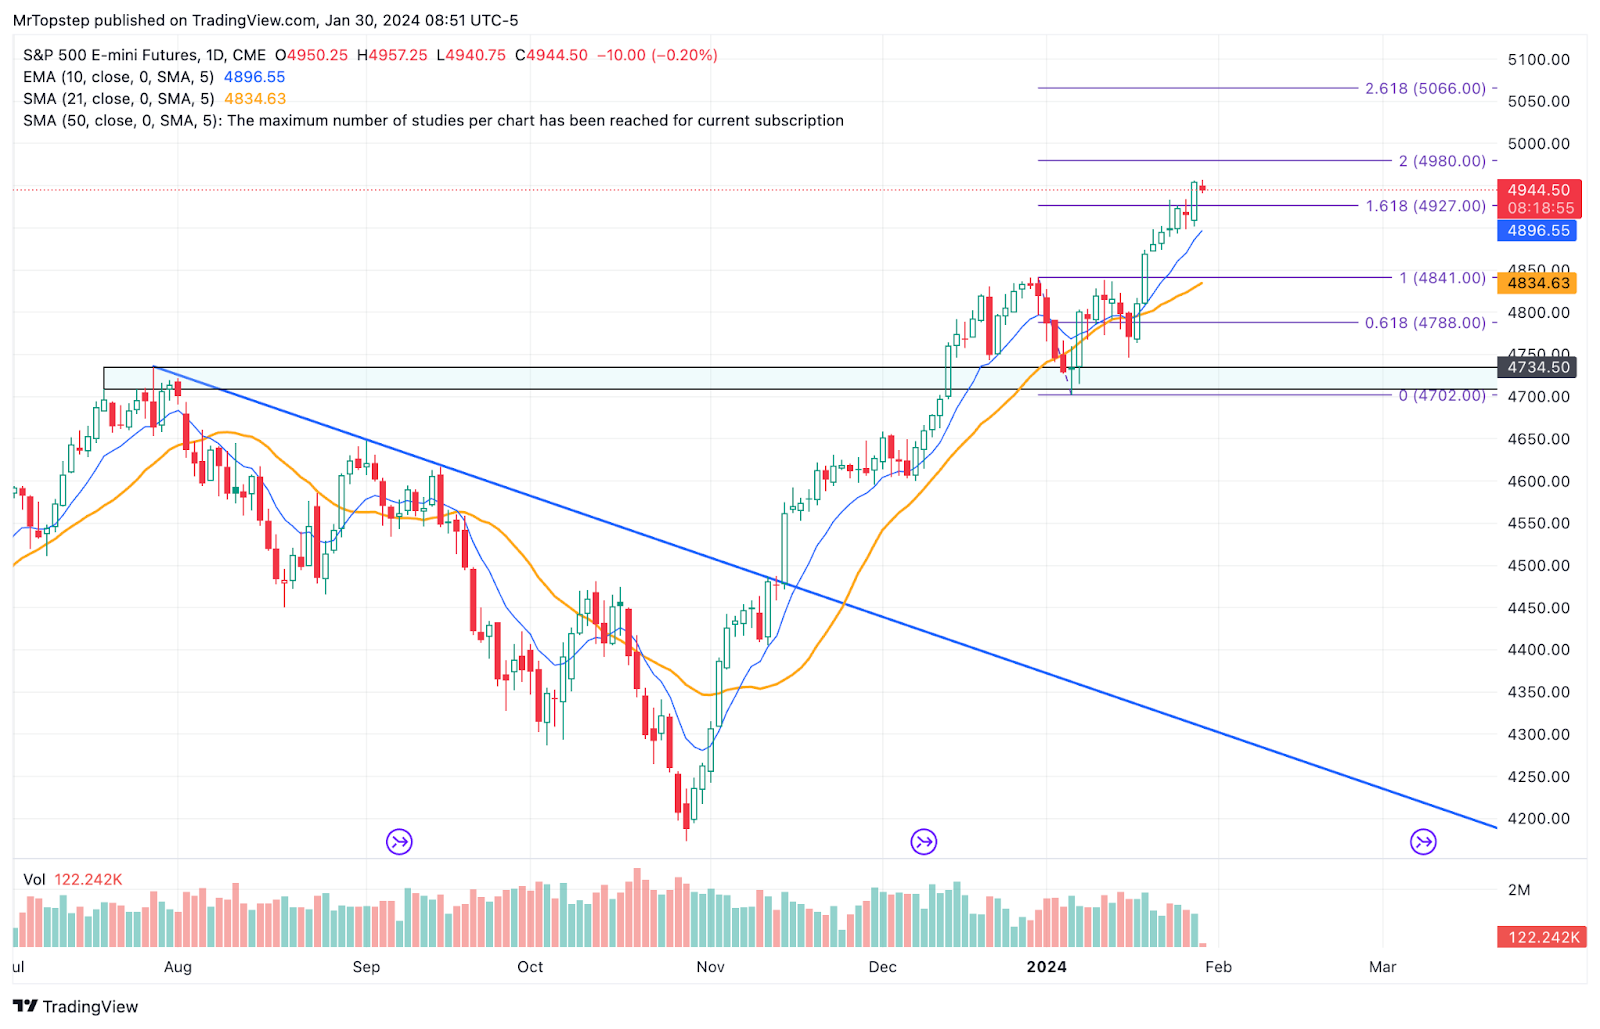
ES Daily
-
Upside: 4980, 5000, 5020, 5050-60
-
Downside: 4925-30, 4890-4900
NQ
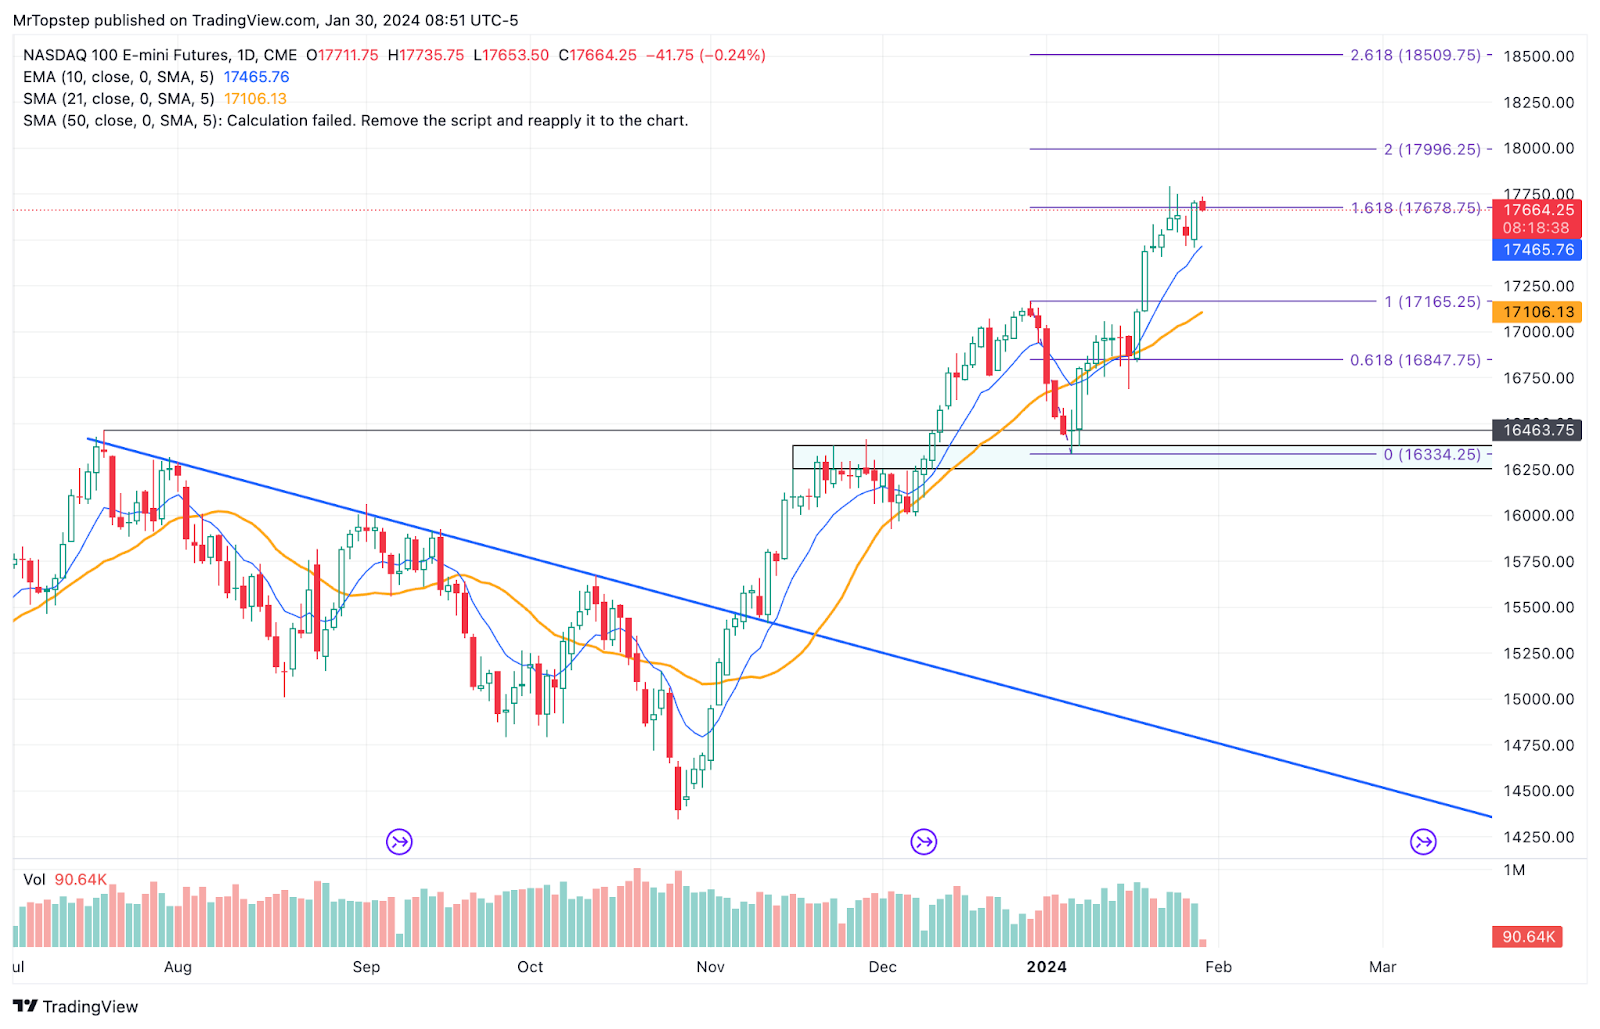
NQ Daily
-
Upside: 17,750 to 17,800
-
Downside: 17,575 to 17,600, 17,450 to 17,475, 17,375
Guest Post — Niels from Tradrr
MSFT earnings after the bell, while holding within the top 10 for the DOW in terms of weight of that index, places YM in an interesting position after the NYSE close.
-
Holding this months majority of volume makes it a target for the coming month should we begin to fail at holding the next bulk of action above it found in.
-
The chop of the previous week sets up a range we could easily fall back into and if acceptance is found whilst rejecting the higher prices this image places us at from Mondays close opens up the rules of balance to begin targeting the other side of the established balance.
-
Having peeked into these prices prior from last Friday and now bursting up and above on Monday gives a line to be defended otherwise opening up the scenario for rejected higher prices to find solace in last weeks balance.

Should MSFT earnings be unable to sustain the moment for this balance break failing to protect section 3 we’ll return to the chop zone of section 2 whilst monitoring sellers attempt to take the ball and run for a break out of balance lower targeting the initial edge of section 1 for the week.
Economic Calendar

Comments are closed