Higher Stock Prices and Lower Rates?
Either way, there will be dips.
Follow @MrTopStep on Twitter and please share if you find our work valuable!
Our View
I like the fact that the markets have rallied so much, but a lot of recent bullishness came from the public jumping on the “6 rate-cuts bandwagon” — we all know that’s not going to happen.
Like I have said before, I bet there are no rate hikes in the first quarter and if things heat up, it may take even longer. Current odds are about 60/40 favoring “no cut” in the March meeting.
The other part is, what if the Fed does start cutting and the markets start selling off?
I think that is what happens when you reverse interest rates. While my longer timeframe view for 2024 is for higher prices — and most of the stats say the same thing — I don’t think the S&P just goes higher and higher without any pullbacks or selloffs.
I get hundreds of bank reports sent to me and the ones I like to look at most are Barclays, Goldman Sachs, and JPMorgan. I am not avoiding critiquing the newsletter, but I think it’s better that you read it yourself, and form your own opinion:
My guess is the Fed lowers but in a much more guided way.
Our Lean
Volume died yesterday, maybe it has to do with the deluge of S&P 500 earnings this week. I am not changing my tune, I still think we see higher prices, but I am also cautious.
The markets need balance and right now the ES and NQ are overbought. Does that mean lower prices are coming? It could, but not in a low-volume environment like yesterday.
Our Lean: We could see some cold water thrown on the ES and NQ, but that won’t last. You can sell the early rallies and buy the pullbacks or just be patient and buy the 20 to 30-point pullbacks.
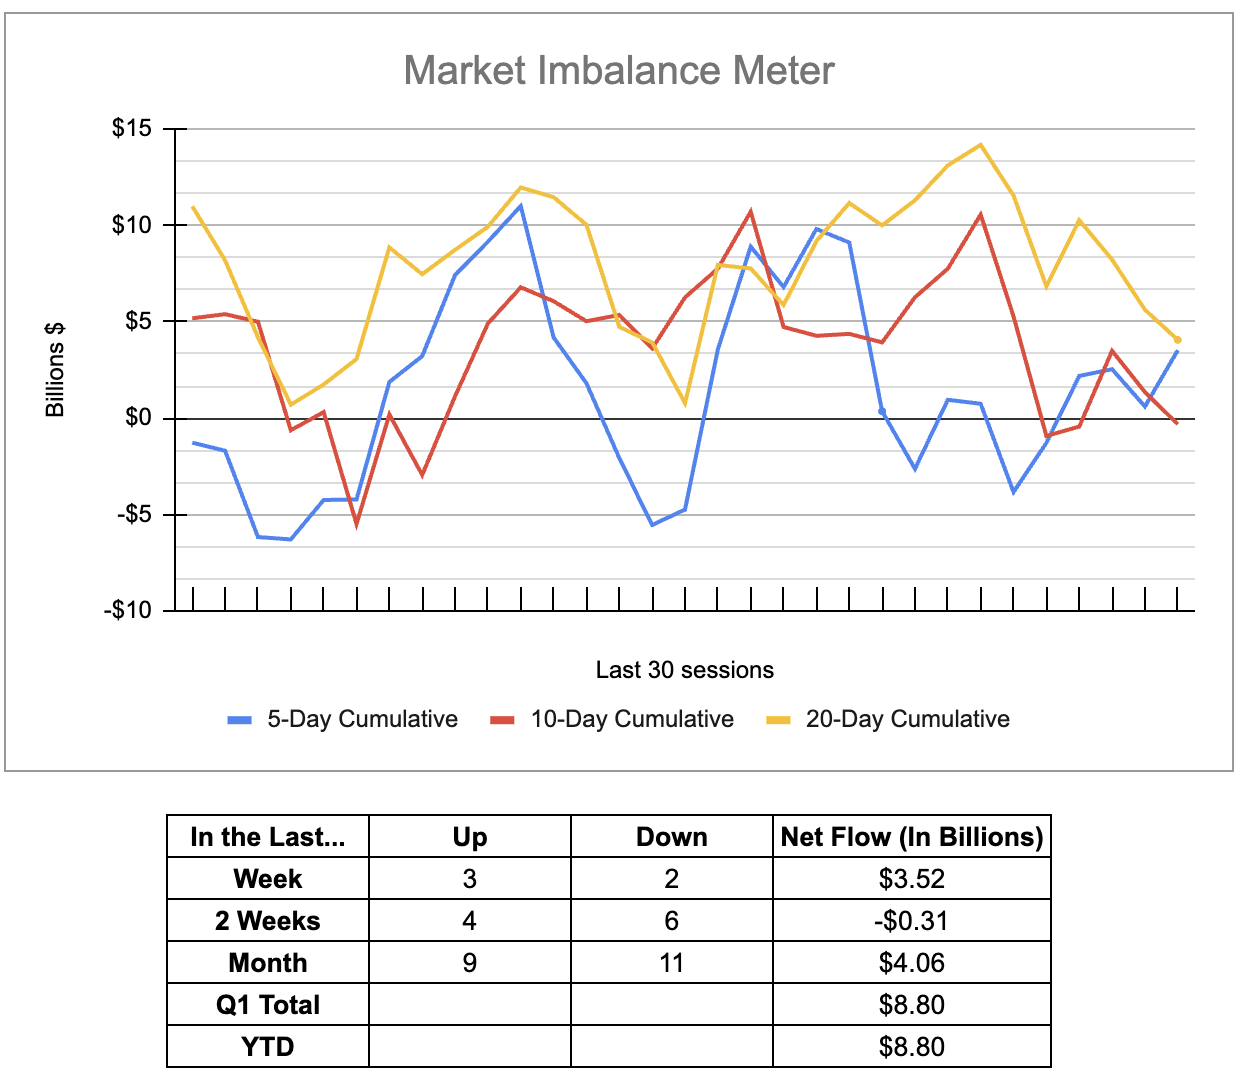
MiM and Daily Recap
ES Recap
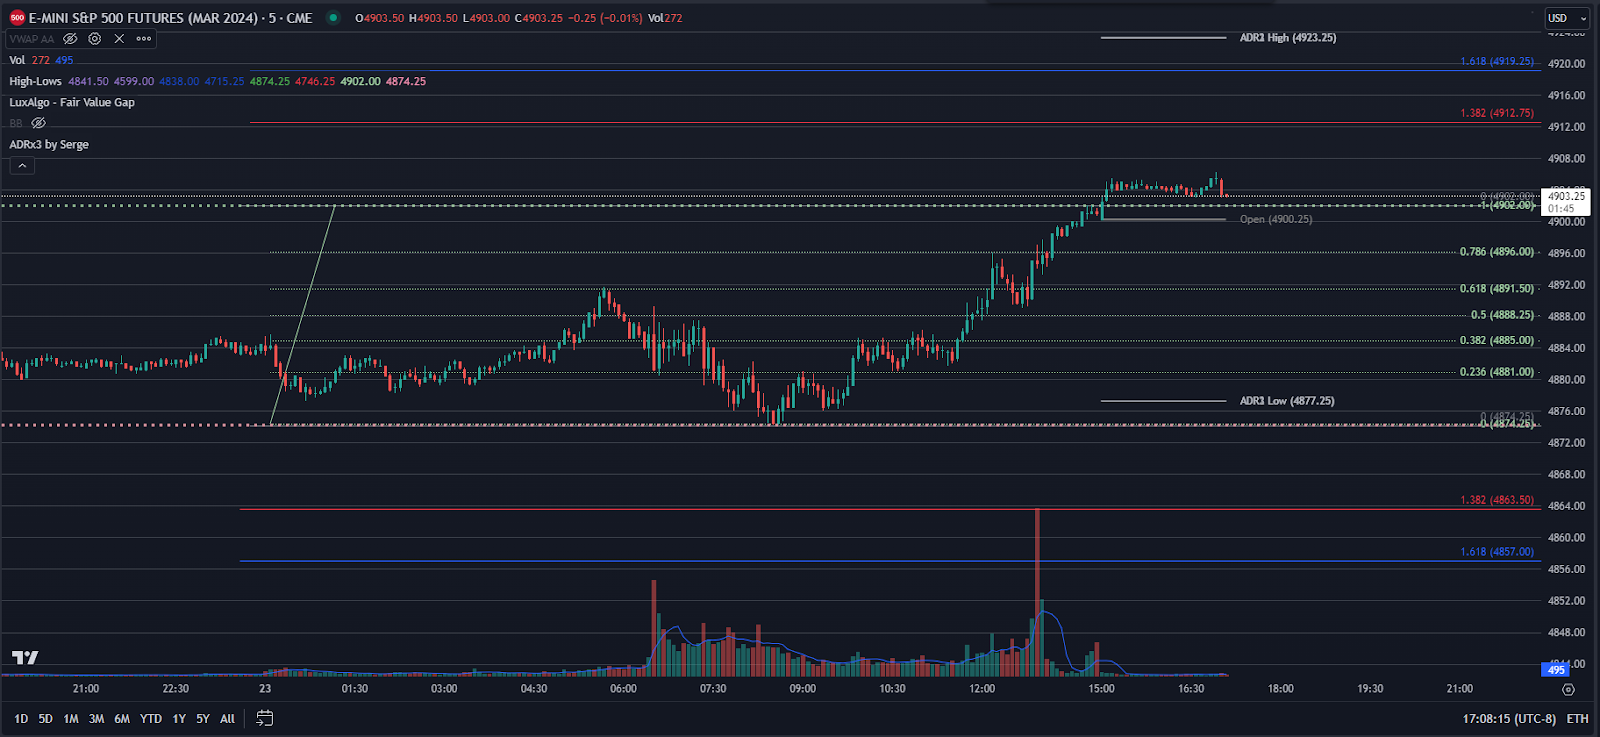
The ES traded down to 4877.25 on Globex and opened Tuesday’s regular session at 4885.75. After the open, the ES rallied up to 4891.75, sold off down to 4880.50 at 9:36, and for the next 39 minutes traded in a narrow back-and-fill near the VWAP from 4887.50 to 4880.50, and then slowly broke down to a new daily low 4874.25 at 11:43. After the low, the ES traded up to a 4885.25 double top at 1:26 and then and then made 5 new highs up to 4896.00 at 3:12 as the early imbalance showed $101 million to sell.
The ES sold off down to 4889.00 at 3:43 and traded 4890.50 as the 3:50 cash imbalance showed $638 million to buy, traded 4895.50 on the 4:00 cash close and settled at 4901.00, up 20 points or +0.41% on the day. The NQ settled at 17,552, up 0.54%, the YM settled unchanged and the RTY closed at 1,989.80, down 6.5 points or -0.33%.
In the end, the ES did sell off, but volumes were so low that “thin to win” took over. In terms of the ES’s overall tone, it never really acted bad. In terms of the ES’s overall trade, volume was low: Only 185k contracts traded on Globex and 868k traded on the day session for a total of 1.071 million contracts traded.
Technical Edge
-
NYSE Breadth: 62% Upside Volume
-
Nasdaq Breadth: 69% Upside Volume
-
Advance/Decline: 48% Advance
-
VIX: ~12.50
ES
Notice how both the ES and the NQ are getting into their upper 161.8% extension targets. Does not mean they can’t go higher, but a noteworthy area in both instances.
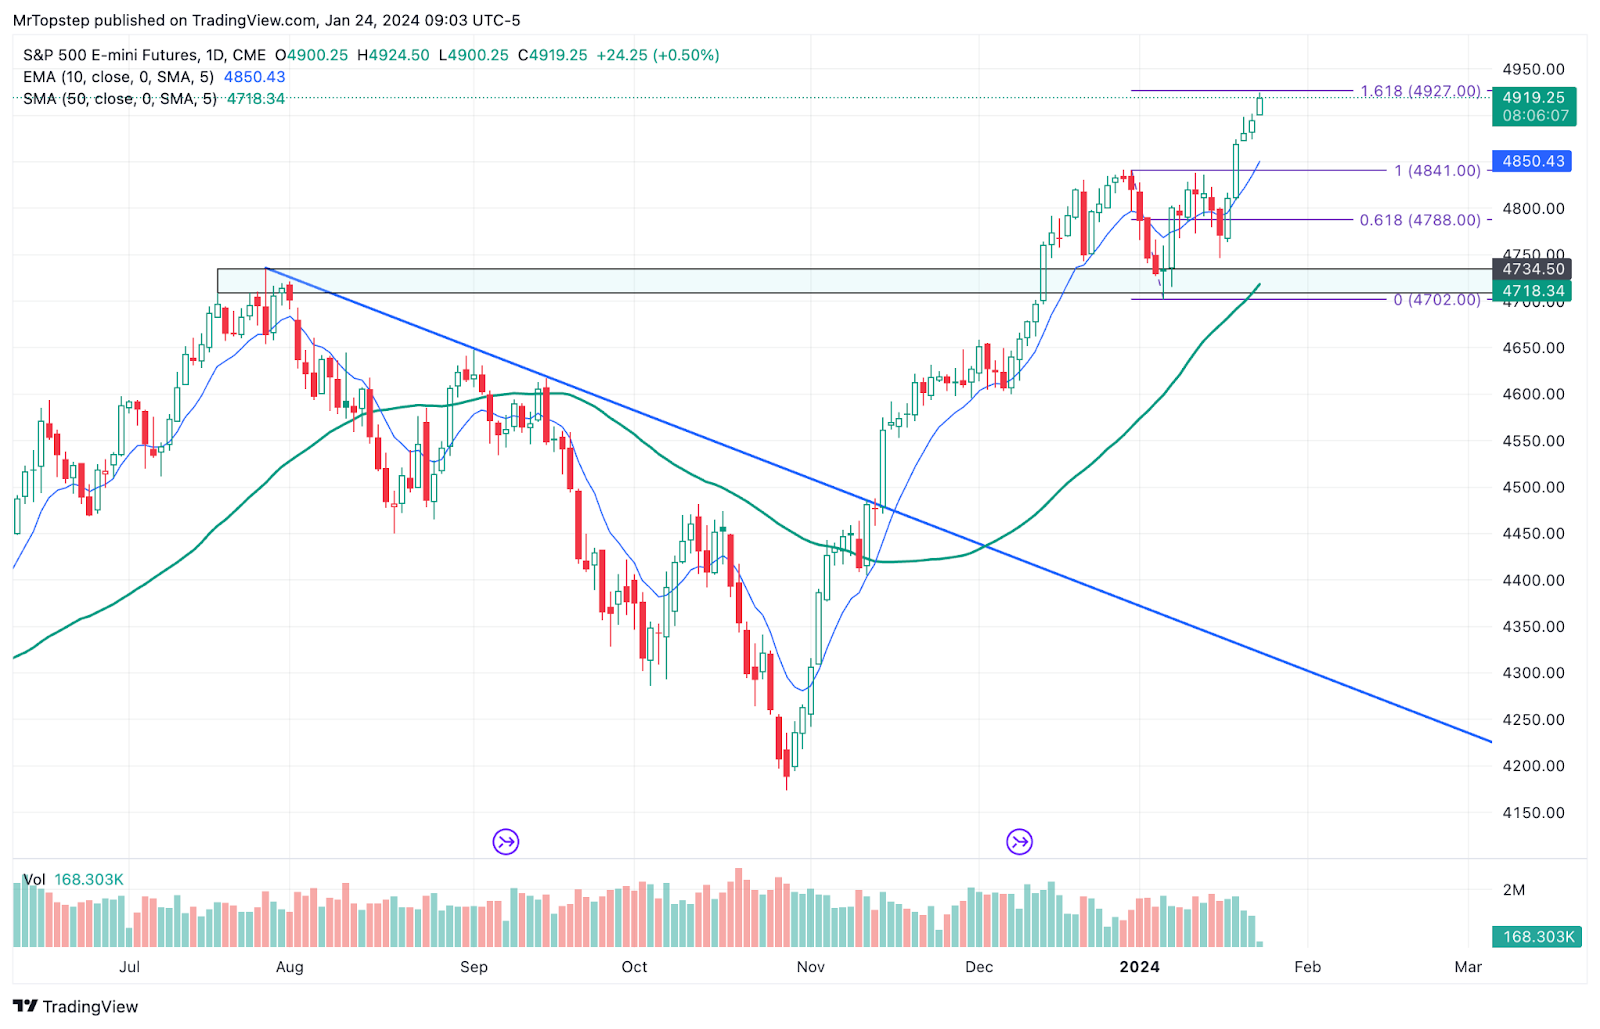
Daily ES
NQ
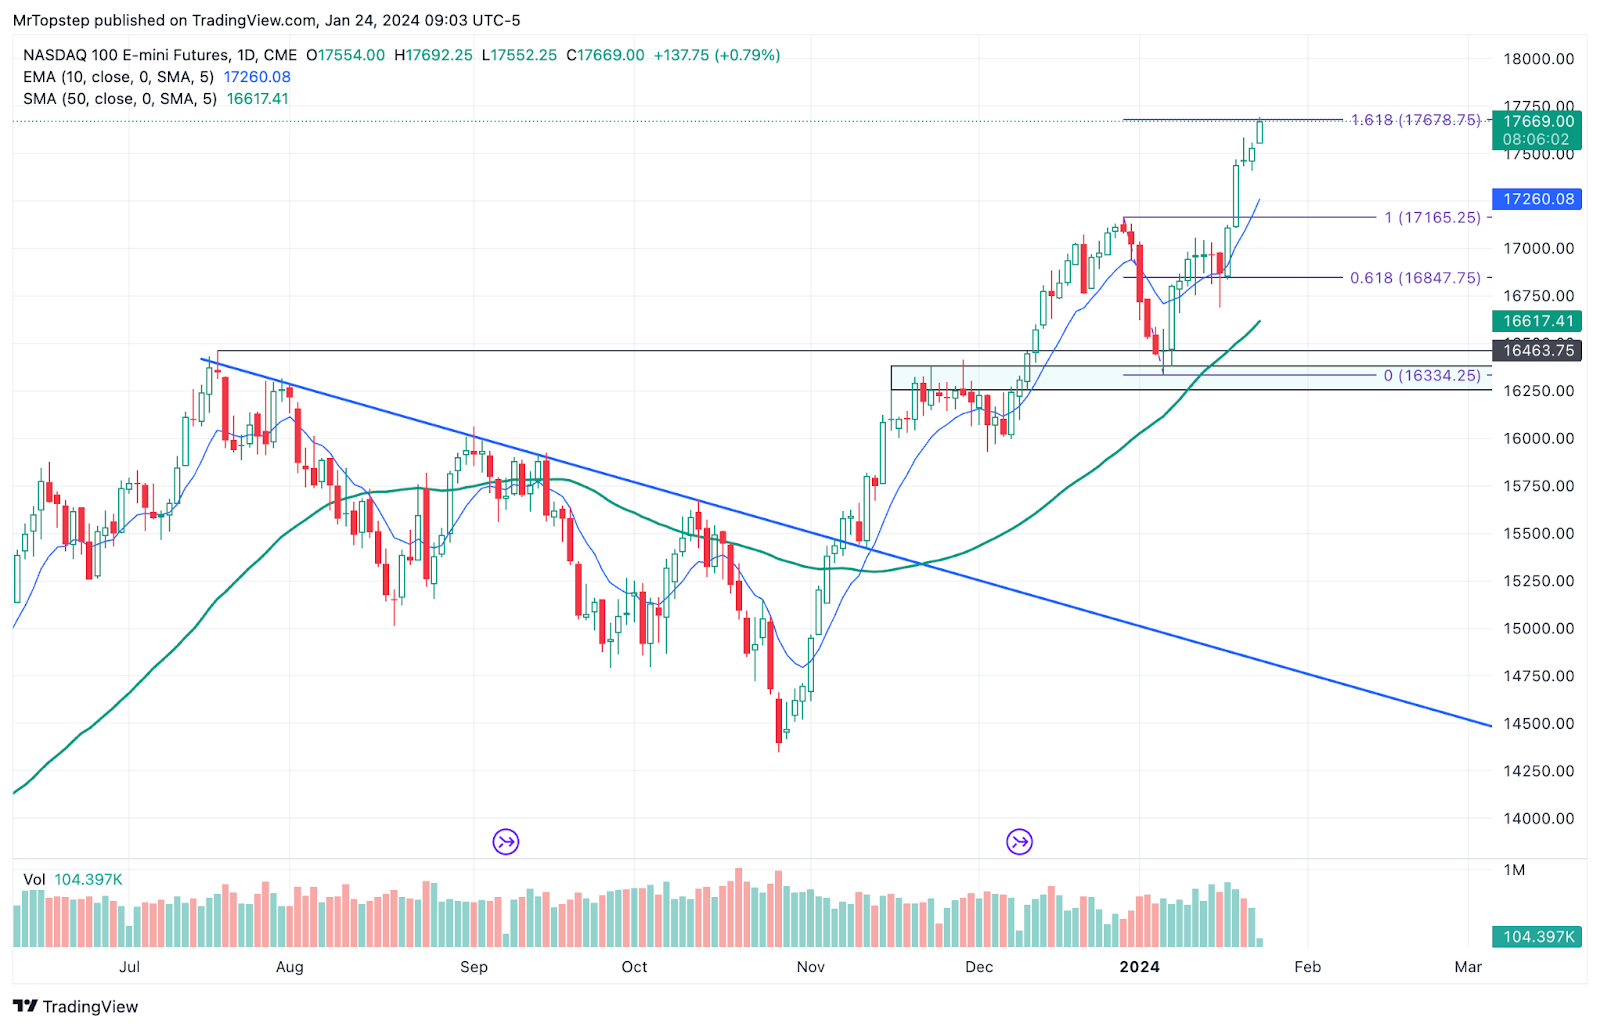
NQ Daily
Guest Post — Polaris Trading
PTG/Taylor Three-Day Cycle
Author: David D Dube’
Website: https://polaristradinggroup.com/
Prior Session was Cycle Day 1 (CD1): Markets continued to consolidate recent gains as price established a new Cycle Low at 4874.25, while holding the 4880 (LIS) firm bid as outlined in prior DTS Briefing 1.23.24. Prior range was 27 handles on 1.085M contracts exchanged.
…Transition from Cycle Day 1 to Cycle Day 2
This leads us into Cycle Day 2 (CD2): Price is “clicking” at prior session’s Initial Target Zone (ITZ) high edge @ 4905 at time of this writing (7:30 pm). Three-Day Cycle Rally targets 4815, as momentum is building for a “trend-continuation” scenario. The Key Support Zone is now marked between 4875 – 4880. As such, scenarios to consider for today’s trading.
Bull Scenario: Price sustains a bid above 4890, initially targets 4910 – 4915 zone.
Bear Scenario: Price sustains an offer below 4890, initially targets 4880 – 4875 zone.
PVA High Edge = 4887 PVA Low Edge = 4875 Prior POC = 4883
*****The 3 Day Cycle has a 91% probability of fulfilling Positive Cycle Statistics covering 12 years of recorded tracking history.
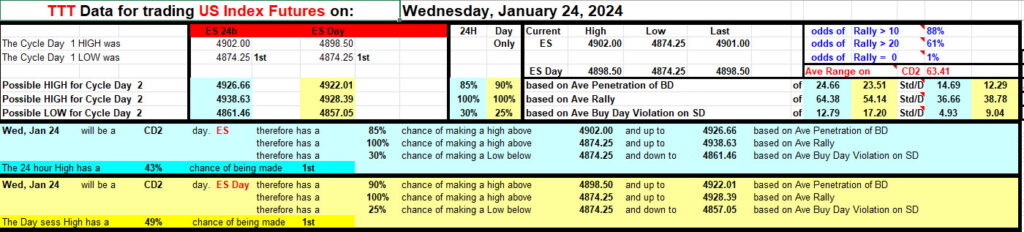
For more detailed information for both bullish and bearish projected targets, please visit: PTG 3 Day Cycle and/or reference the Cycle Spreadsheet below:
Link to access full Cycle Spreadsheet > > Cycle Day 2 (CD2)
PTG Subscriptions: https://polaristradinggroup.com/subscriptions/
Thanks for reading,
PTGDavid
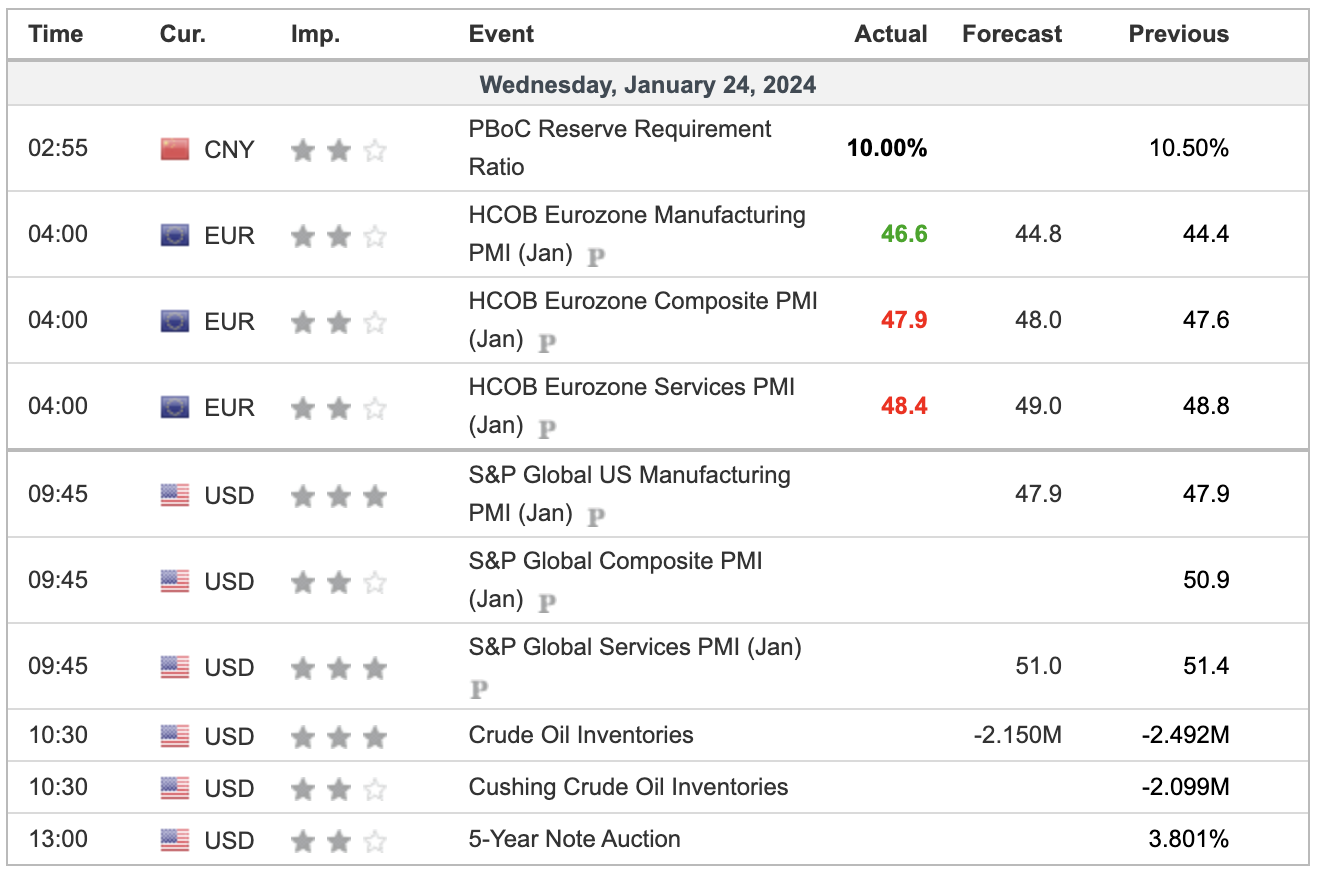
Economic Calendar
Comments are closed