I’m Still Bullish, but More Cautious
Follow @MrTopStep on Twitter and please share if you find our work valuable!
Our View
I can’t tell you how many times I saw the markets stop at or new a new high — or up against a big round number and a new high/low.
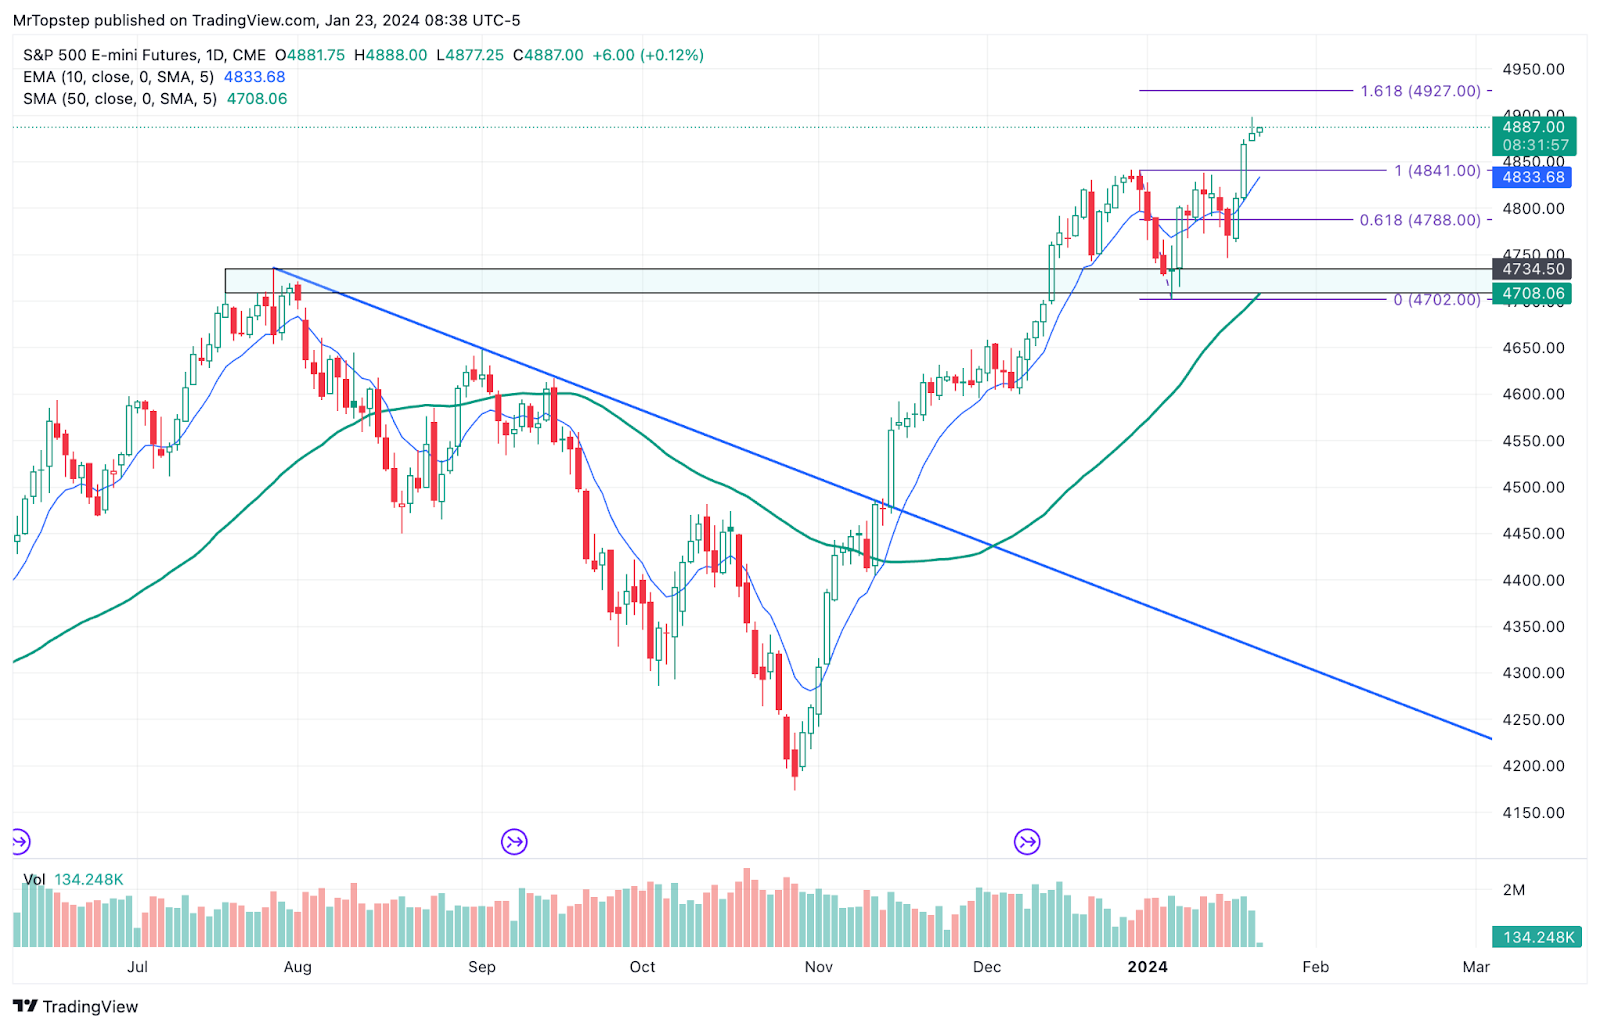
On this specific occasion, it was a big gap higher and then a rip and instead of punching out 4900, it puked down to 4875.25. I think this is normal price action after a three-day 152-point rally.
I want to make something clear: I’m still bullish, but more cautious. The ES is in need of a further pullback and some lower back-and-fill.
Our Lean
I may be wrong, but I am going to be selling the rallies. This doesn’t mean I won’t buy a 20- or 30-point pullback, but the ES has run a mammoth amount of buy stops and the NQ has rallied almost 900 points from Wednesday’s low.
I don’t think if you are a buyer the ES will get away from you at this level.
MiM and Daily Recap
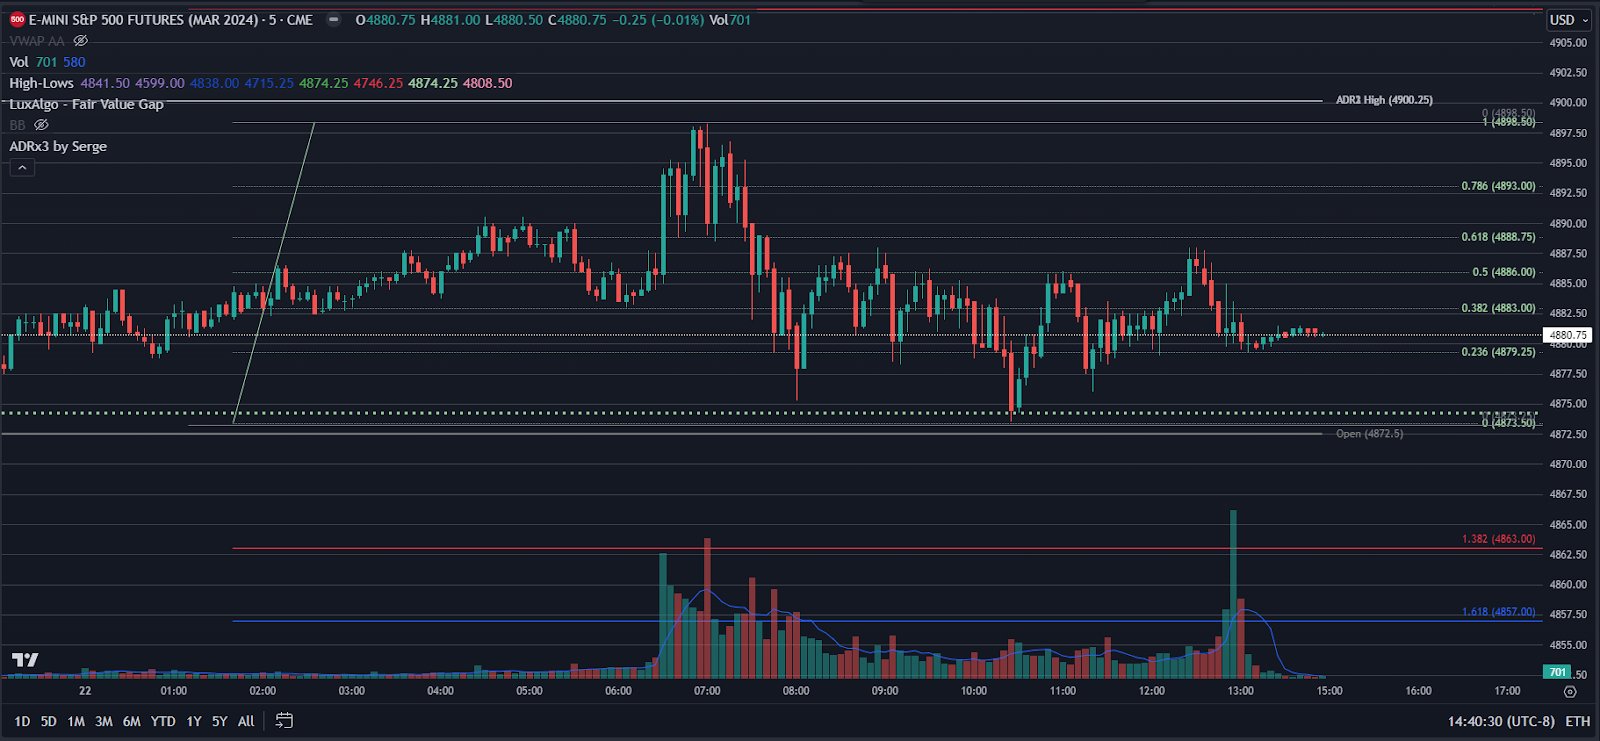
The ES traded up to a new all-time contract high at 4890.50 on Globex and opened Monday’s regular session at 4885.75. After the open, the ES traded 4848.50, rallied up up 4898.25 at 10:02, dropped down to the 4888.50 level and back-and-filled in a 5-point range, and then stutter-stepped down to the 4875.25 low at 10:02, and then rallied up to 4888.00 at 12:03.
After the high, the ES sold off down to 4873.50 at 1:31 and then slowly rallied back up to 4888.00 at 3:33 as the early NYSE stock order imbalance $483 million to sell. From there, the ES traded down to 4880.50 at 3:49 and traded 4885.00 as the final 3:50 cash imbalance showed $1.13 billion to sell and traded 4881.75 on the 4:00 cash close and settled at 4880.75, up 11 points or up 0.23% on the day.
In the end, it has been a long journey for the S&P 500. It has weathered the Covid-19 pandemic, higher interest rates and inflation, and all the geopolitics, today making a new all-time contract high.
In the old days when I was on the floor, the locals and the desks would be cheering a milestone like ES 4900, but the floors are closed and no one is cheering. In terms of the ES’s overall tone, it got bid up late in the day, but down-ticked as the NQ fell. In terms of the ES’s overall trade, volume was lower: 279k traded on Globex and 1.025 million on the day session for a total of 1.304 million contracts traded.
I consider myself a flow guy, I don’t watch or listen to CNBC, Bloomberg, or FOX Business. I create my own flow based on prior patterns and order flow. What happened after yesterday’s open was two-fold. The first part is, the ES is overextended/overbought after a big gap-up open and the second part is the 4900 level. I don’t think it goes through there without a fight.
Below is a list of messages I put in the MrTopStep chat when the ES was at or near the highs of the day.
-
IMPRO : Dboy : (9:49:20 AM) : I think you have to be careful up here
-
IMPRO : Dboy : (9:49:33 AM) : there is going to be a drop
-
IMPRO : Dboy : (9:50:34 AM) : this could be a TRAP up here
-
IMPRO : Dboy : (9:51:34 AM) : this isn’t like going through a previous high
-
IMPRO : Dboy : (9:52:15 AM) : 4900.00- 4920.00 BRICK
-
IMPRO : Dboy : (9:57:07 AM) : I am not sure how to do it but I think do a lotto short option trade here or scale up a little from here
-
IMPRO : Dboy : (9:57:40 AM) : this looks way too easy to be long here, sold 1 nq at 36.00
Technical Edge
-
NYSE Breadth: 63% Upside Volume
-
Nasdaq Breadth: 73% Upside Volume
-
Advance/Decline: 76% Advance
-
VIX: ~13.50
ES
Levels from HandelStats.com
ES Daily
-
Upside: Trade and hourly close above 4889.75 targets 1sd at 4906.90. Hourly close above there targets 4920.85. Hourly close above there targets 2sd at 4934.05 Hourly close above there targets 3 sd at4961.20.
-
Daily close above 4920.85 targets 4997.75
-
-
Downside: Trade and hourly close below settlement at 4879.75 targets 4870.80, then -1sd at 4852.60. Hourly close below there targets 4842.12, then 48333.75, then 4824.88 and -2sd at 4825.45. Below there 4814.50, then -1sd weekly at 4810.17, then -3sd at 4798.30.
Guest Post
This is from my friend Niels at Tradrr.
Coming into January 23rd of the year 2024 we have no notable news till after the close to hear from Netflix and their 4th quarter earnings. Keeping this in mind could bring about a balancing act near these highs awaiting possibly catalysts from said earnings. section 3 being a very wide pivot to gauge further upside or rest back within previous balance.
TTT – Tradrr Tuesday Technicals

1. With last week’s action testing the volume built around the start of the month, we were left with a clean low confirmed by tapering volume / interest to trade lower.
2. Coming into the session for Tuesday we have a noticeable flat top to our profile indicative of an attempt to keep prices from moving up higher and should it be taken out could incur the running of a few stops up.
3. Testing within the imbalance could be an ideal environment to safely trend either higher towards new all time highs or retrace towards more familiar waters built around the 2nd week of this month. TNF – Tradrr News/Fundamentals Coming into January 23rd of the year 2024 we have no notable news till after the close to hear from Netflix and their 4th quarter earnings. Keeping this in mind could bring about a balancing act near these highs awaiting possibly catalysts from said earnings. section 3 being a very wide pivot to gauge further upside or rest back within previous balance.
As for gold…

GC
-
Tested and filled out an imbalanced portion that came about from the move down at the start of this month. This in turn drifted price lower and through the balance of the 2nd week of January.
-
Looking to the left we had a flat bottomed profile indicative of presumed absorption the momentarily held prices of which was broken through and volume built below into a clean taper back to previous balance of the 2nd week of January.
-
From last week gold balanced slightly lower than the balance of the 2nd week of January placing into a situation of a larger balance for gold overall. More of the same till we can get a meaningful break through the previous 1st and 2nd references.
Comments are closed