Low Volume Feels Like Summer Trading
More upside left in the tank?
Follow @MrTopStep on Twitter and please share if you find our work valuable!
Enjoy today’s abbreviated Opening Print alongside an expanded guest post.
Our View
I don’t pretend to know everything, but something is going on with the volumes. The schools have not let out yet, but like I said yesterday, it really seems like the summer trade has begun.
Does that mean volatility is going down? No, it doesn’t. What it means is there are going to be slow chops followed by big moves. While the US indices were flip-flopping around, the Stoxx Europe 600, FTSE 100, and Dax indexes all closed at fresh record highs.
Our Lean
Today is another day of only one economic report and one Fed bank president speaking. On the earnings front, most of the big names reported yesterday, including Uber, Arm Holdings, Robinhood, and Airbnb.
When I look at the daily ES chart over the past four days, I see a big ‘back and fill’ pattern. Even on the down open yesterday, @HandelStats was still saying there is a big upside potential; I have to agree.
Our lean is we can’t rule out selling a rip, but I’m sticking with buying weakness. Lastly, should the ES sell off a bit, I’ll be looking for the PitBull’s Thursday low ahead of next week’s monthly opex.
MrTopStep Levels:

MiM and Daily Recap
ES Recap
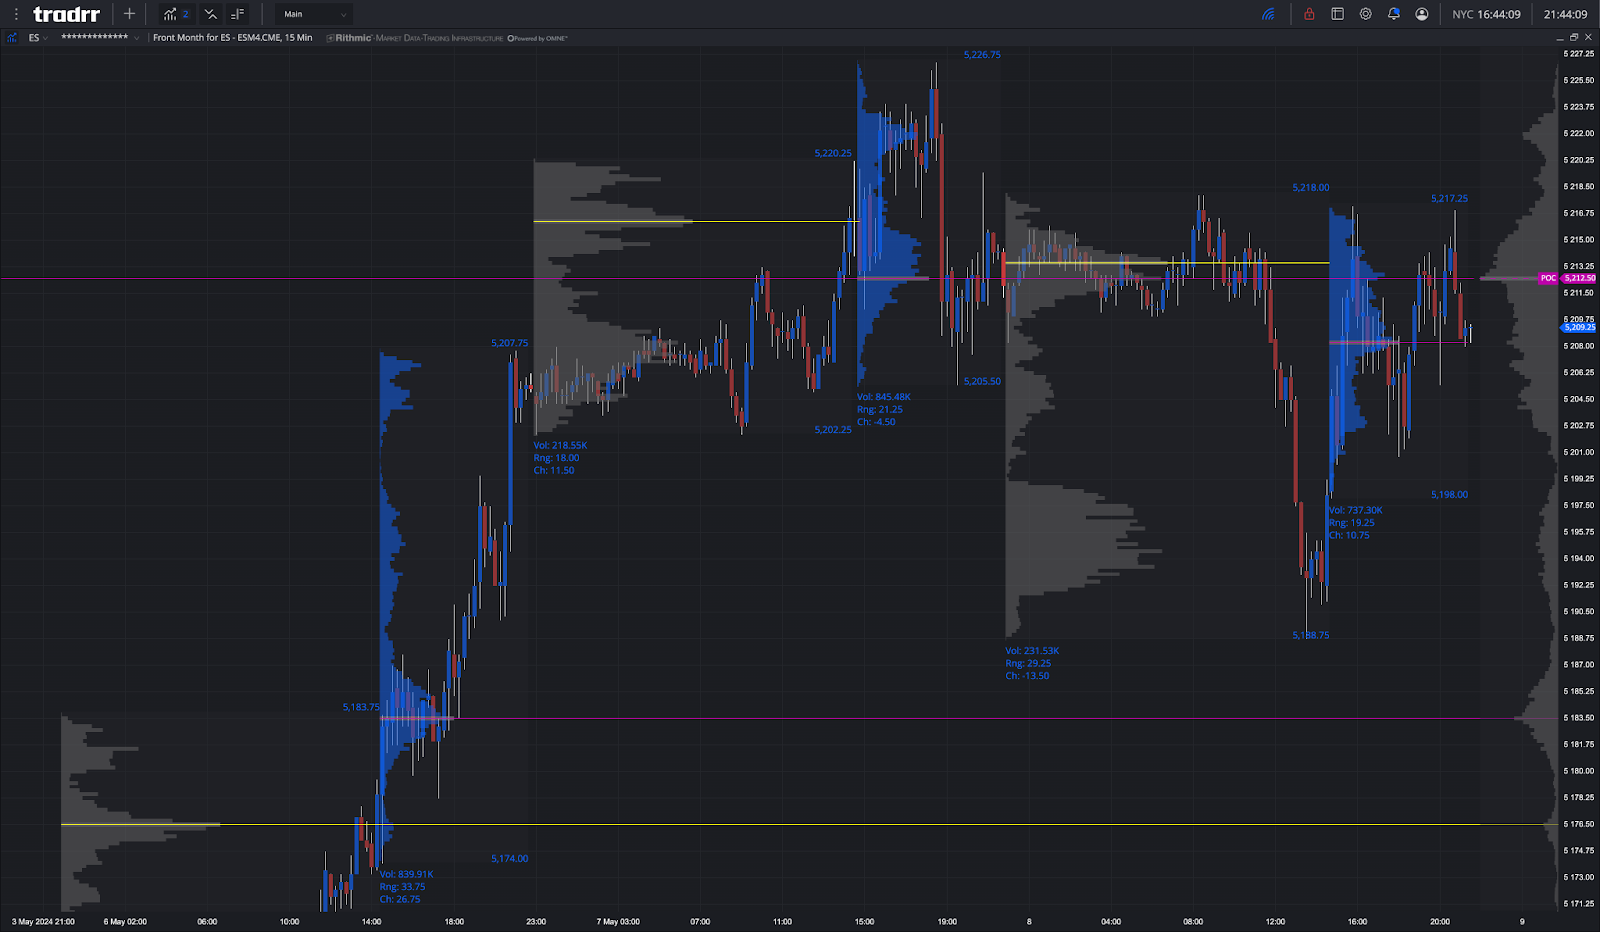
The ES sold off down to 5188.75 and opened Wednesday’s regular session at 5192.25. After the open, the ES traded 5191.25, rallied up to 5204.50 at 9:57 and then rallied up to 5217.25 at 10:50. It pulled back to 5212.25, rallied up to a lower high at 5216.75 and then sold off down to 5206.25 at 11:17 and then back-and-filled in a 4 to 5 point range until the ES sold off to 5200.53 at 1:02.
After the low, the ES rallied up to 5214.25 at 2:37 and then pulled back just below the VWAP at 5205.50 at 3:03, rallied up to 5210.00 at 3:09, downticked and traded up to 5214.75 at 3:27 and pulled back to the 5112.50 area at 3:42. The ES traded 5215.75 as the 3:50 cash imbalance showed $740 million to sell and traded 5212.00 on the 4:00 cash close. After 4:00 the ES traded down to 5208.25, traded back up to 5211.00, and settled at 5210.00, down 3.75 points or -0.07% — its smallest point move since 2018. The SPX closed lower by 0.03 points or 0.00%.
In the end, the Dow closed higher for the 6th session in a row, while the ES, RTY, and NQ wavered. In terms of the ES’s overall tone, it did shake off the early weakness with the help of the NQ, but both finished well off their respective highs. In terms of the ES’s overall trade, volume was low again: only 174k traded on Globex and 795k traded on the day session for a total of 969k contracts traded. Volume has been anemic this week.
-
NYSE Breadth: 47% Upside Volume
-
Nasdaq Breadth: 50% Upside Volume
-
Advance/Decline: 44% Advance
-
VIX: ~13
Guest Post — GTC Traders
This is a long guest post with some excellent commentary. For the full post (and for those that prefer PDF viewing over email, please visit this link).
Stumped?
I am thankful to Danny for the opportunity of this guest post. We’re new to the education space. Sort of. That’s a long story, for another time.
But we are not new to trading, we have a combined experience of nearly 100 years among partners. I’ve been trading for nearly 30 years; and got my start in the 1990’s; and am now the Senior Partner in a Private Prop Firm. The larger corporate structure has given me the go-ahead to begin “GTC Traders”, that allows new and aspiring traders to ‘look over our shoulder’, and you can find us at https://gtctraders.com/.
Danny has graciously provided us with a room at Mr. Top Step.
However I must admit at first to being somewhat stumped as to how best to explain our approach to the trading environment we find ourselves in.
Not that I am in any way stumped as to market discussions, or what I think of markets at the moment.
It’s just that we attempt to be agnostic as to what any given market regime will throw at us. Trending markets, volatile markets, bear markets, ‘choppy’ mean-reverting markets. And our approach is somewhat different than many traders.
So how do I explain our approach?
What do I mean? Well, I thought it best to begin by explaining …
-
A common problem we see with new and aspiring traders, which leads to …
-
Our approach, and thus …
-
Why we are agnostic as to this given market environment, and then finally …
-
Our current thoughts on the markets in general and various strategies we demonstrate.
Myopic Views on Strategy and “Method Hunting”
We feel something holding back the risk-adjusted performance of many new and aspiring traders is the myopic belief that one secretly guarded ‘setup’ or ‘system’ exists of ‘entering’ and ‘exiting’ a market. Or that there is a ‘best’ setup. Newer traders seem to believe that if they learn such a ‘setup’ with the correct ‘entrance’ and proper ‘exit on a single strategy (and of course the rest of the trading industry is ‘in on’ these ‘secrets’) they would then achieve consistent profitability. This mindset really defines an almost universal near-sighted approach to trading on the part of new and aspiring retail traders. And that such an approach …is really all there is to trading.

When point in fact finding a profitable methodology or ‘system’ of trading is not really what we find to be the biggest obstacle facing struggling traders.
Ironically, the above myopic belief is actually their biggest obstacle.
Many new traders find it surprising when we tell them that when it comes to longer multi-day trading … profitable trading methodologies are plentiful, and information on them is readily accessible. Not from supposed ‘FURU trading educators’ of course. Such ‘educators’ usually offer little more than ‘snake-oil’. Instead … almost all new traders we encounter, remain fixed in the myopic concept of: “Find the ‘right’ trade entrance, trade exit, and thus ‘setup’ and ‘trading system’”.
Their sights remain fixated on finding ‘the right’ methodology. Which leads to a concept that I myself have long referred to as “method hunting”. In other words, the new trader encounters a loss, or a series of losses using a methodology and mistakenly believing that this means that the ‘system’ or ‘method’ is at fault. Although that loss, or series of losses may be a complete statistical normality for that process. Perhaps the approach does very well in trending markets, and the market is experiencing some short-term chop. If they would just stick to the iterative process of trading, they would return to profitability once again.
Yet they feel that they need to ‘tweek’ the process or ‘hunt up‘ a new method. In point of fact, losses and series of losses are absolutely normal to the best of traders and best of trading methodologies. One of the worst things a new and aspiring trader can do, is try to discard a perfectly viable trading method that encountered a series of statistically normal losses in order to “hunt up a ‘new method’” to avoid such discomfiture. This leads to an endless cycle and futile search for a method that avoids a series of trading losses. At best. But truthfully, profitable strategies are almost a dime a dozen, and can be found from credible academic, scholarly and institutional sources. Sources that have thoroughly tested such approaches with both historical data, and in an ongoing live environment.

In point of fact, new and aspiring traders run into a host of other problems since this simplistic view of trading causes them to ignore larger issues, like objective and most importantly … strategy thesis non-correlation.
Naturally we admit that any trader would want a reasonable return, with as little volatility in the returns as possible. “I just want the returns to go up!”. This is only natural, and as long as one avoids the above psychological ‘traps’, traders should strive for a good risk adjusted return. Meaning, they should wish for as little drawdown as possible, while still earning a good return.
That goal, is the “Mount Everest” that all traders attempt to climb.
Few succeed.
(article was trimmed here to fit in one email. Please visit this PDF for more)
Current Thoughts
Macro-Economic Background: We believe we have begun (begun) to see the start of a Equity Bubble, that is beginning in Tech with AI stocks.
We have read Ray Dalio’s thoughts on this topic, and suggest that everyone read his piece. We agree with much of what he has to say. However, we would respectfully point out that much of his analysis has to do with when a stock market bubble has fully formed, and has become excessively apparent.
We believe that we are not quite to that level. Bubble’s begin in sectors, and they spread. We believe we are in the beginning phase of a Bubble, that has it’s genesis in A.I. We have held this belief since November of 2023.

And simultaneously? We believe find ourselves in a contradictory inflationary environment. For a host of reasons we are in the “Higher for Longer” or “H4L Camp”. We have been taking our cues from the SOFR market; specifically the June 2025 contract (SR3M25). While we may enjoy a ‘relief’ rally to lower yields, we feel this will be temporary; as a reverse of Globalization is leading to ‘sticky’ structural inflation within the United States.
These two forces are fighting one another at the moment. Good news on the A.I. Front fueling a small, introductory bubble in tech. Inflation and higher interest rates attempting to dampen. It’s a light econ week, and we feel the chop we’ve seen is only to be expected; as the market vacillates between inflation worries, and “growth” news in A.I.
Our “Equity-Value-Income” ‘Desk’ (2 Year to Indefinite Periodicity): We have just bought more of IBM (An asset we have believed in holding for years), at yesterday’s close, and believe it to be a good average buy in, at these levels in the $170.00 region. However, we are keeping our purchases to half of their usual size. Our focus has been, as Berkshire Hathaways focus has been, to build cash reserves. So while we do still make purchases. We are keeping the purchase size light, with plenty of room to hedge off this entire side of the portfolio to a very specific hedging strategy.

Thus far in this section of our book has bought and continues to hold PCY, JNK, SPHD, COST, DEO, KR, UNP, XLU, WFC and NTSX. And now, IBM. A small hedge 10% hedge is still on against the recent downturn in terms of SH. These pieces have outperformed the market in the last month.
Valuation Desk (1 Month to 4 Years): As stated, our focus is building our cash reserves. We have no specific asset in the valuation side of our book.
However … with a Portfolio Margin or Margin account? We have been taking the Total Net Liq of the entire portfolio (all strategies capital combined) and buying the 4 Week Bills each month; that averages around ~+5.2% annualized return. Most brokers will allow you to buy 4 Week Bills from the Secondary Market and only use 4% margin. Which is a decent return in and of itself off the margin used.
So by way of example, if a Portfolio is running multi-strat, and it’s total net liq is $1,000,000.00? Then only $40,000 is used in margin to hold those 4 week bills. We are segmenting for ‘record-keeping sake’ to the Valuation side of the book. And this simultaneously keeps us to our overall strategy of building cash.
Short-Term Trading Desk (0 to 45 Days): Though the SH position is to hedge the Equity-Valuation LT holds, we actually treat and manage the position itself as a short-term trade. We have trimmed the hedge to a small 11% position against the Equity Valuation side of our book.
We are eyeing the ~5280 region on the SPX.
As long as we are below this ~5280 region? We will maintain that 11% hedge. We may even increase the size of this hedge against the longer-term assets, during market downturns.

But at the moment? As long as we remain below that ~5280 region, we maintain the 11% hedge.
We are also eyeing that ~5280 structure as a possible short to scale into. That is … if we ever get there.
In the mean-time? We sold a 45 DTE SPY 21 Jun 547/475 Strangle for 1.97 on 5/7/2024 and are managing that position with distant deltas. This lends weight to our belief in some chop in coming days. Let that theta bleed off, and collect it; taking advantage of the chop with distant deltas. We also have an order in to close down that trade if it reaches 50% of the max profit potential. So if reach 0.98 or 0.97 on that particular strangle? We’ll just take the profit of the position.
We continue to hold a basic mix from 5/3. Per $50,000 in cash, ratio’d out to 22 QQQ, 212 SHY, 15 SPY and 85 TLT as a very basic mix, being held as a multi-day trade, as a relationship trade. If we begin to sell off in broad risk, we may dump this position for a small loss.
We then sold calls against the TLT position, selling 1 May 31 95 Call against the TLT held. For the GTC Sample Portfolio, this is 1 TLT 95 Call sold, that is partially covered. We didn’t raise a lot of premium with IVR so low, but it is something in terms of premium.
Summary
Where’s the market going? Beats me. Don’t know. Don’t care. I do know, I like “win-win” scenarios.
We rally higher? Great. Our longer-term Equity-Valuation-Income hybrid process should continue to do well. We just picked up more IBM at a song, and perhaps that piece can participate as well. Dividends are coming in from each piece, padding the account over time.
We dump over the next few weeks? I already have an 11% hedge on against those assets, and can add to the hedge; as I dump my’ basic risk mix ‘SPY-TLT-QQQ-SHY trade’. But we’ll be enjoying the 4 Week Bills come to yield, as this pads the entire account, regardless of what happens.
We chop around?
Ok, then the SPY option strangle should continue to do well, and collect the theta off those distant deltas. If I have to manage the SPY Strangle? I can do that too. At the same time, the TLT calls are collecting theta (what little there is, since the IVR was so low).
Non-Correlation of strategy thesis.
The positive expectancy of all of the strategies together, should keep us moving forward.
Comments are closed