New Buyers or Just a Dead-Cat Bounce?
Is the rebound legit?
MrTopStep and @HandelStats have come up with a one-time limited offer for a combined room, where you will get all the MTS tools and a very extensive amount of insights and resources designed to elevate your trading game.
This combined offer is packed with tools, resources, and direct access to expert insights, all tailored to help you navigate the markets more effectively and make informed trading decisions. Whether you’re looking to deepen your market knowledge or enhance your trading strategies, this comprehensive package offers a wealth of information and support to help you achieve your trading goals.
Don’t miss out on this exceptional offer to elevate your trading to the next level. With only 20 spots available at this special price, ensure you secure your place in this combined room to leverage the full potential of the TraderPro Service and the expertise of MrTopStep and @HandelStats.
Our View
After a vicious three-week selloff that ended with 6 down days in a row, the ES has bounced 150 points from its lows on Friday. It’s a simple question: Have the S&P and Nasdaq made a low?
Remember, I’m always bull and looking for lows but not everyone agrees. JPMorgan’s chief market strategist Marko Kolanovic wrote in a note on Monday:
“Price action may depend on earnings and could stabilize near-term, but beyond this, however, we think the sell-off has further to go. We remain concerned about continued complacency in equity valuations, inflation staying too hot, further Fed repricing, and a profit outlook where the implied acceleration this year might end up too optimistic.”
Kolanovic went on to say that “The current market narrative and patterns are increasingly resembling those of last summer, when upside inflation surprises and hawkish Fed revisions drove a correction in risk assets, but investor positioning now appears more elevated.”
I agree with part of this, but we all knew the Fed was wrong when they forecasted 3 rate cuts in 2024 and yes the markets got spooked as the public became increasingly pessimistic about the Fed cutting rates at the end of the summer in 2023. But I think the difference is it’s an election year and the government is going to do everything it can to keep the stock market rolling — but that doesn’t mean they won’t be volatile.
Our Lean
The ES all-time contract high is 5333.50, and the recent low is 4962.25, which is a 371.25 point drop. Half of that is 156.25 points or the 50% retracement comes in at 5147.875. The ES has rallied 156.25 points in the last two days, but one of the hallmarks of the rallies has been the late day or into-the-close selling.
In the last two days when the ES sold off late, it rallied on Globex, opened high, pulled back and rallied.
I’m not sure what to say other than what I have been saying in the Mr. Top Step chat, which is that it’s all buy stops up to 5120. Yes, there are more stops and shorts to squeeze out, but I think the 50% retracement level could be a potential resistance level. If the ES gaps higher, I want to sell the open or the early rallies and if the ES gaps 10 to 20 lower I want to lean into the long side.
I don’t think the rally is over, but there could be some earnings shake out. Other levels of interest on the upside include: 5150, 5164, 5173-75, 5186.50 and 5198.00.
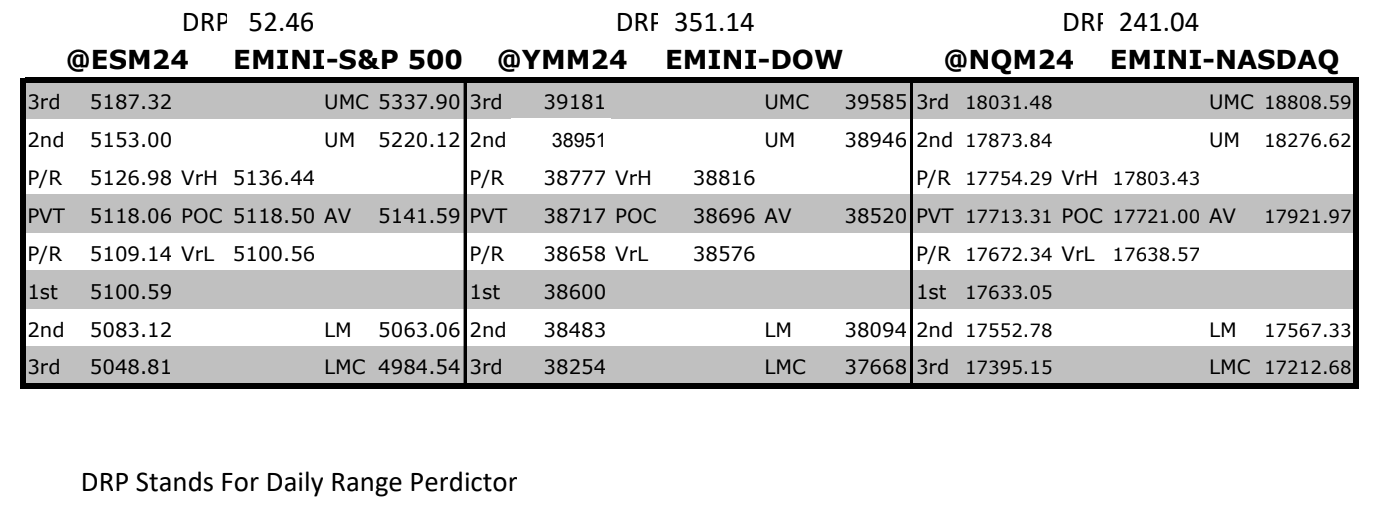
MrTopStep Levels:
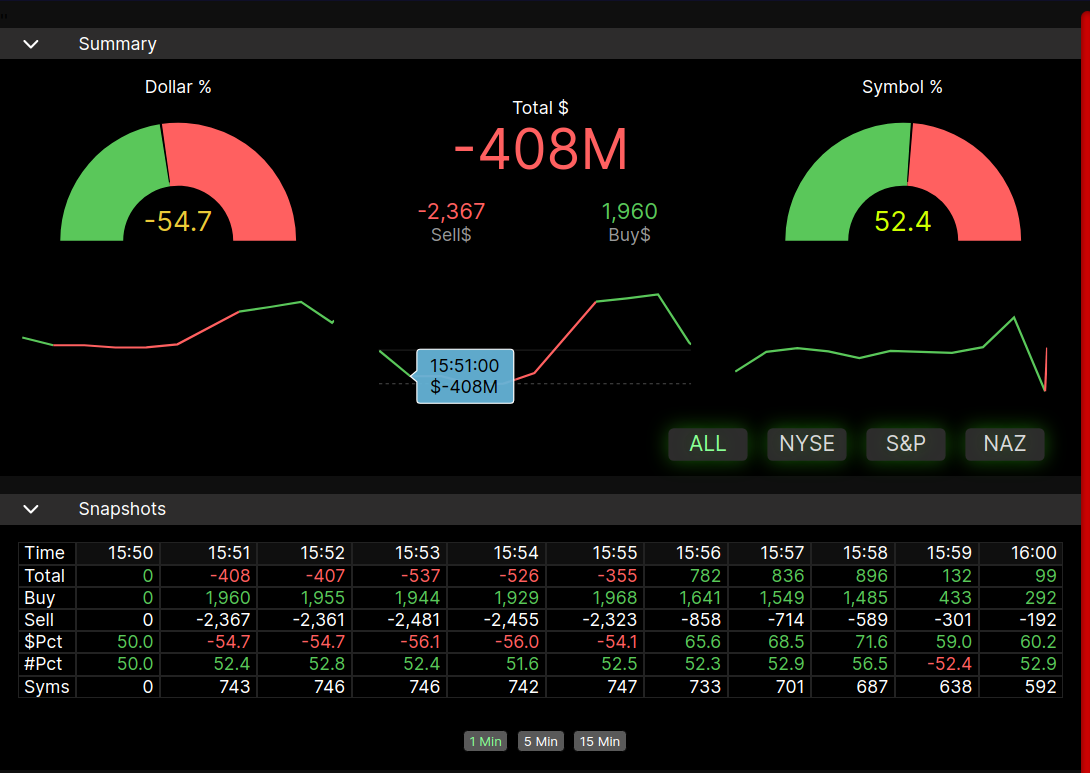
MiM and Daily Recap
ES Recap
The ES traded up to 5069.00 and traded 5069.50 on the regular session open. After the open, the ES 5070.75, pulled back to the 5063.75 level at 10:00, pulled back to 5078.50, and rallied up to a new high at 5096.00 at 10:30. After the high, the ES dropped a few points and then rallied up to another new high at 5105.50 at 11:00 and then pulled back to the 5092.25 level at 11:30, made a lower high at 5102.25 and rallied up to a new high at 5106.75, made another new high at 5108.00 and pulled back to 5101.25 at 1:00.
After the pullback, the ES rallied up to a new high at 5112.75 at 2:00 and pulled back to the 5106.75 level at 2:30 and then double topped at the 5112.75 at 3:00. From there, the ES pulled back to 5101.50 at 3:30 and then rallied up to a lower high at 5108.75 at 3:47 and traded 5106.50 as the 3:50 cash imbalance showed ~$400 million to sell and traded 5107.75 on the 4:00 cash close. After 4:00, TSLA shares ripped higher despite a top- and bottom-line miss and the ES rallied up to 5113.50 and settled at 5112.25, up 63.25 points or +1.25%, the NQ settled at 17,656.00, up 316 points or +1.82%, brent crude oil rose to close at $88.42 a barrel — off its recent high of $91.17 hit earlier this month — and the 10-year note yield fell to 4.597%, from 4.622% Monday.
In the end, we had Mutual Fund Monday followed by Turnaround-Tuesday yesterday. In terms of the ES’s overall tone, it was firm but I’m trying to figure out how much of the rally is new buying versus short covering. In terms of the ES’s overall trade, volume was lower: only 207k traded on Globex and 1.1 million traded on the day session for a total of 1.208 million contracts traded.
Technical Edge
-
NYSE Breadth: 80% Upside Volume (!)
-
Nasdaq Breadth: 70% Upside Volume
-
Advance/Decline: 82% Advance (!)
-
VIX: ~15.75
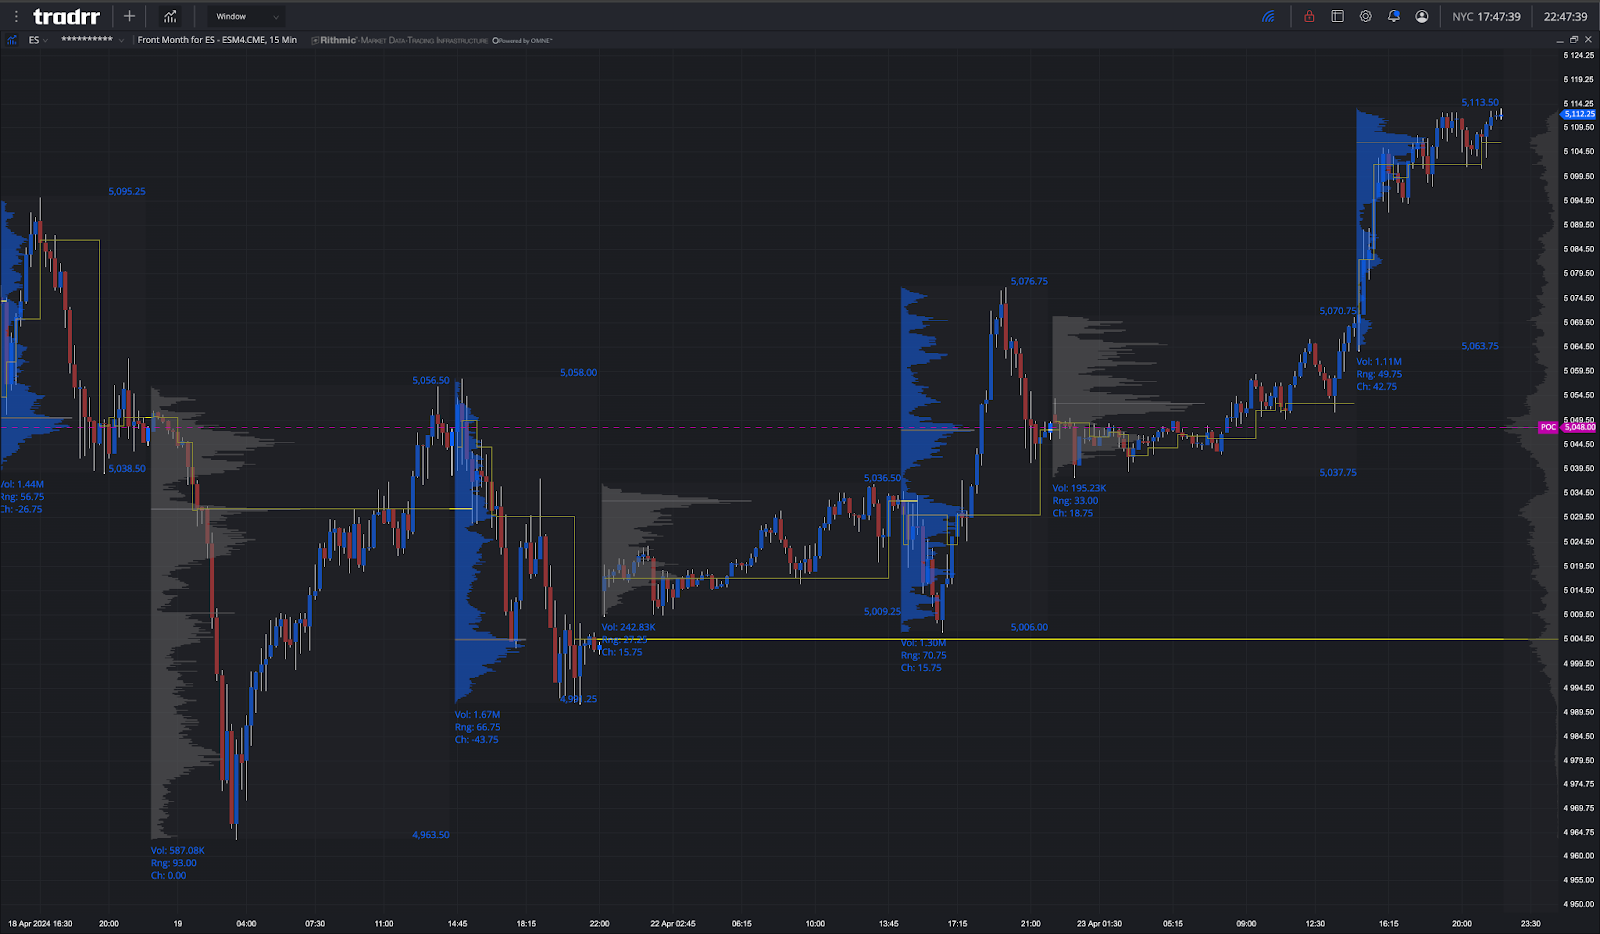
ES

ES Daily
Guest Post — Polaris Trading
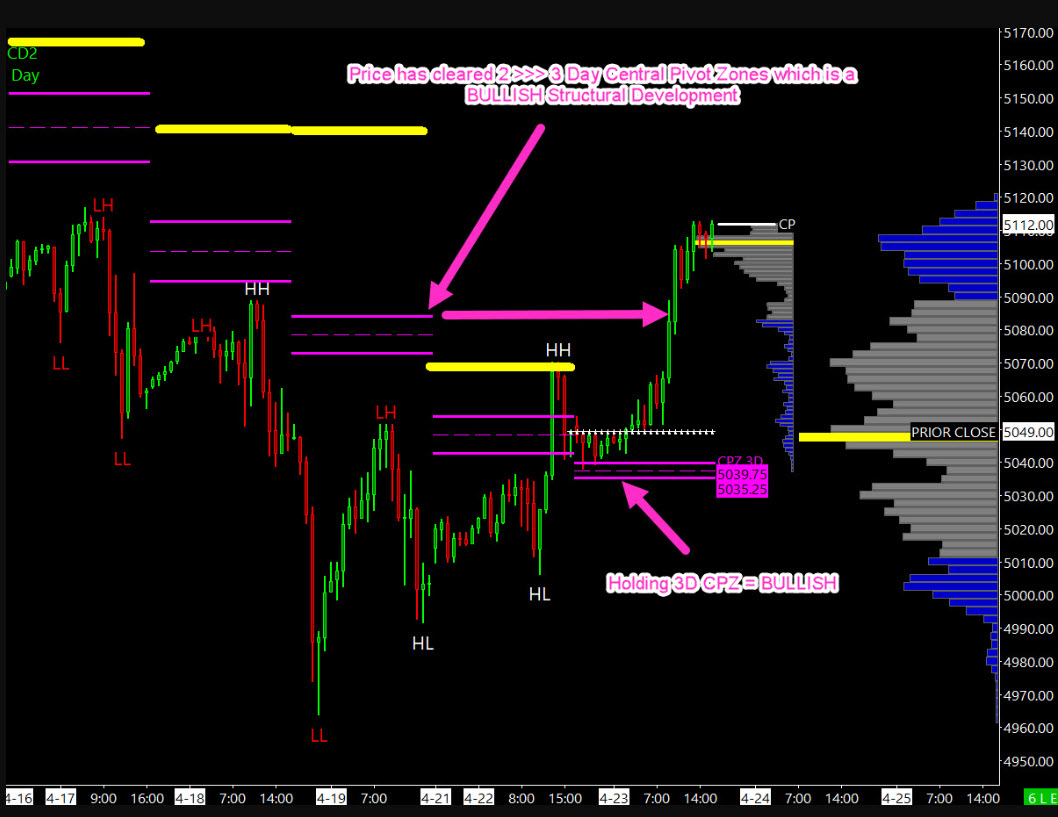
Prior Session was Cycle Day 2: Cycle rally continuation was this session’s trading theme as price surpassed 3 Day Cycle Target (5078), extending upwards to Statistical Deviation Levels (5102 – 5112). Range was 75 handles on 1.297M contracts exchanged.
***NOTE: IF you want to learn more about how the 3-day cycle levels are derived, THEN check out the FREE TRIAL offer below. Cycle Analysis is an integral part of the PTG Methodology.
…Transition from Cycle Day 2 to Cycle Day 3
This leads us into Cycle Day 3: Price closed near the upper edge of CD2’s range with bulls in dominant control. 3 Day Cycle Targets have been surpassed…Hence we’ll mark today’s session as a “wild-card”, meaning further upside potential exists, though the next decline could begin at any time.
As always, our tactical trade plan remains unchanged…Stay in alignment with dominant intra-day forces. As such, scenarios to consider for today’s trading.
Bull Scenario: Price sustains a bid above 5100, initially targets 5125 – 5130 zone.
Bear Scenario: Price sustains an offer below 5100, initially targets 5085 – 5080 zone.
PVA High Edge = 5112 PVA Low Edge = 5085 Prior POC = 5106
*****The 3 Day Cycle has a 90% probability of fulfilling Positive Cycle Statistics covering 12 years of recorded tracking history.
Thanks for viewing…PTGDavid
Economic Calendar
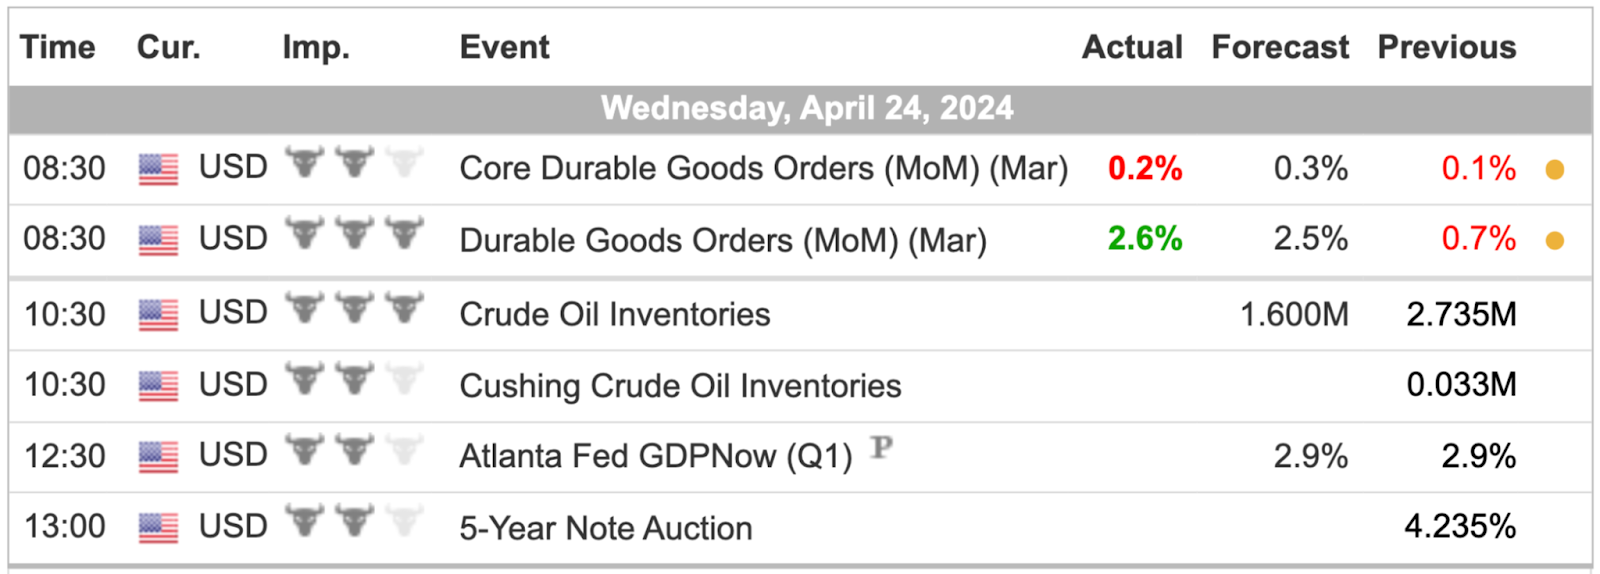
For a more complete Economic Calendar see: https://mrtopstep.com/economic-calendar/
Comments are closed