New Highs Y’day
Our View
To the new readers, I am not here to tell anyone to buy or sell, that is up to you. What I am here for is to give a feel of the direction and to help pick out patterns. Part of this comes from my experience on the S&P desk and having all the buy and sell orders, buy and sell stops, and seeing how they were constantly movinh up and down. The other is my background in program trading and, last but not least, reading the imbalance charts. The bottom line, don’t judge me over a week or two or a month, like anyone I can go through rough patches.
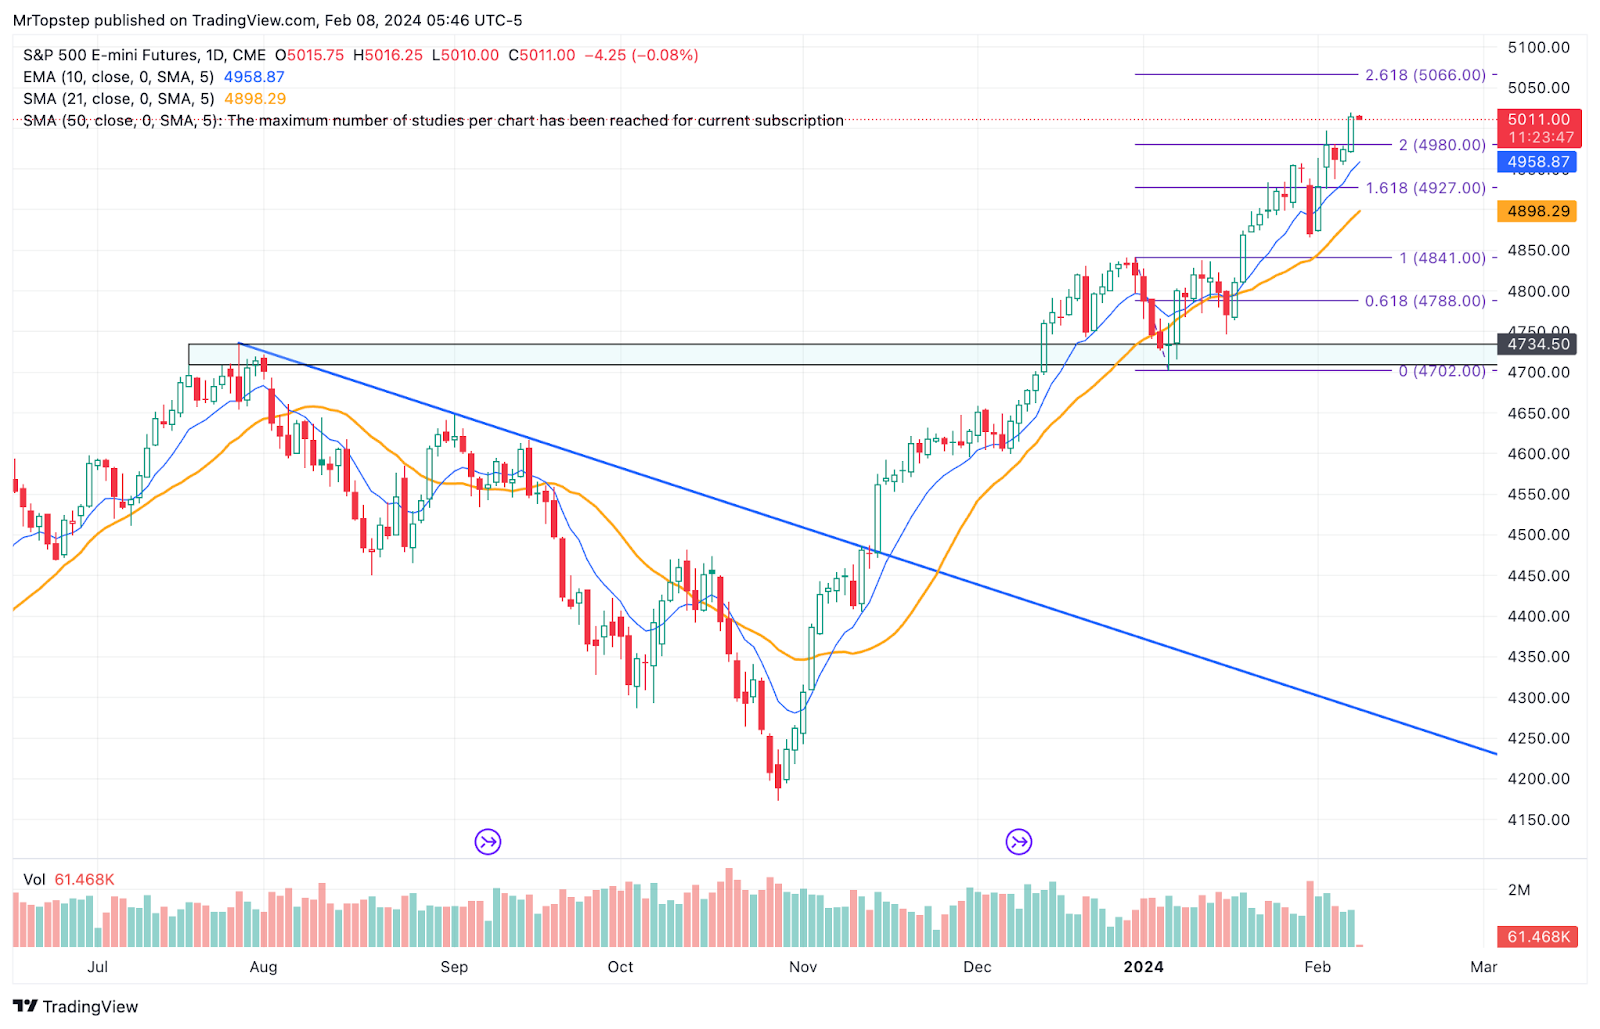
The ES performed nicely yesterday and made a new all-time contract high at 5020.00, a level I posted several times. The momentum never really changed that much when it pulled back over the last few days. I still think any 30- to 50-point pullbacks will be good buy opportunities. Is the Feb weakness over? I still think there will be some drops/dips along the way to ES 5100.
Our Lean
One of the things about trading the ES and NQ is that it is 100% OK to change your opinion. One second you are bearish and talking a lot about lower prices and then the markets rip and you’re now talking the upside. That’s because people that day trade do not hold for days or weeks, they hold for minutes to hours, shorter time frames. Our lean is if the ES opens higher, sell the early rallies and buy the pullbacks. If the ES comes in lower, I am buying the open of the first drop under the gap down open. I’ll figure out the other parts after that.
I don’t know what to say other than there have been some big up Wednesdays and yesterday was one of them. If you recall, I said it was possible the ES would make new highs and it did. Maybe I am making too much out of the weak February seasonals but it’s still early in the month.
RTY liking the yields
MiM and Daily Recap

The ES traded all the way up to a new all-time contract high at 4997.75 at 9:29 am and opened Wednesday’s regular session at 4997.50. After the open the ES traded 4999.25 at 9:32, sold off down to 4988.50, rallied up to a lower high at 4996.50, dropped down to the vwap at 4988.00, rallied up to another lower high at 4994.25 at 10:03, and then down ticked to the 4989.50 level. Each of the lows after the early high was just above or on the vwap and in one bar the ES shot up to 5008.00 at 10:19, dropped a few points, rallied up to 5015.25, dropped down to 5006.75, rallied up to a lower high at 5014.25 at 10:53, sold off down to 5003.00, rallied up to 5013.25, and then sold off down tp 5002.50 at 12:46. The ES traded up to 5016.50 at 1:01, dropped down to 5005.50, stutter-stepped its way back up to the 5019.25 level at 1:31, sold off down to 5010.75 at 1;49, did a sideways to down back and fill down to 5012.50 at 2:39, caught a bid that punched it back up to 5020.00 at 3:08, and then drifted back down to 5014.50 as the early imbalance showed $71 billion to buy. The ES traded down to 5012.00 at 3:44, traded 5013.50 as the 3:50 cash imbalance showed $1 billion to sell, sold off down to 5010.75 at 3:57, and traded 5014.50 on the 4:00 cash close. After 4:00 the ES chopped around in a narrow range and settled at 5015.50 on the 5:00 futures close, up 15.5 points or 0.87%. The NQ closed up 1.8% and the YM closed up 0.45% while the RTY settled down 0.35% on the day.
In the end, Tuesday’s late session move-up set up yesterday’s rally. As I said in the MrTopStep chat, the rally made sense, a few days of tech weakness and the buyers stepped right back in. In terms of the overall tone, the indices in general had a good day. In terms of the ES’s overall trade, 187k traded on Globex and 1.077 million traded on the day session for a total of 1. million contracts traded.

Tecchnical Edge
-
NYSE Breadth: 50% Upside Volume
-
Nasdaq Breadth: 50% Upside Volume
-
Advance/Decline: 50% Advance
-
VIX: ~13
-
Vol contraction ahead of next week’s monthly Opex
-
ES
ES Daily
Trading range for today: 5002 – 5020.
Below 5002: 4994 – 4982 – 4970 – 4960 – 4945 – 4936 – 4920 – 4890 – 4872 – 4860
Above 5020: 5037
Economic Calendar

Comments are closed