S&P Shorts Keep Getting Roasted
and volumes remain low
Hey! There’s a really informative webinar coming up on February 23rd from SpotGamma called “Vanna – Feel The Force (IT’S A TRAP!!!)”
To register for the webinar, please visit this link. I think it will be very helpful and give some good insight into how options impact the market.
Our View
I had the right idea, but I traded poorly. One of the things that happens to me is I start listening to other people instead of just staying firmly with the trend and knowing there will be 50 to 150-point pullbacks.
The markets get weak and everyone gets short and then everyone gets cooked. If anything threw me off it wasn’t the Fed drop — you could see the NQ weakness — but it was the idea that NVDA was going to report weak earnings.
I questioned it too, and a few other traders I talked with were convinced the stock and the markets were going to fall, which it already had. It was a perfect example of what usually happens around a big event: The public gets sucked into selling and then the markets make a major reversal.
Suck the shorts in and spit them out, the S&P and Nasdaq do not give a shit about lower rates.
As it relates to seasonality, this was a good post from my friend Jeff Hirsch over at Stock Trader’s Almanac: March: Historically Solid, but Plagued by Steep Losses in Election Years 1980 & 2020
Our Lean
This is some rough stuff. From Wednesday’s 4959.00 Fed low at 3:24 ET to yesterday’s high of 5107.75 at 2:41, the ES rallied 148.75 points.
One of the hints to yesterday was even after the early pullback, the ES was holding a premium against the S&P cash, it was like telling you, “yes we can go down a little but we have buy programs to do.”
Our Lean: You can sell the early rallies and buy the pullbacks or just buy the pullbacks. We have a trading rule that says after a big move up the ES tends to trade sideways to lower. I’m not sure that will be the case, but it’s very clear that the selloffs add more shorts that in turn help push the ES back up when they inevitably get squeezed higher.
I don’t know if it will get there, but I’m looking to buy 10 to 12 points under the VWAP — one of my new favorite setups.
Lastly and ordinarily, I would be calling for buying a lower open and holding but this is with the ES up so the question is, how much buying is left to do after such a big rally? Well, we will see…
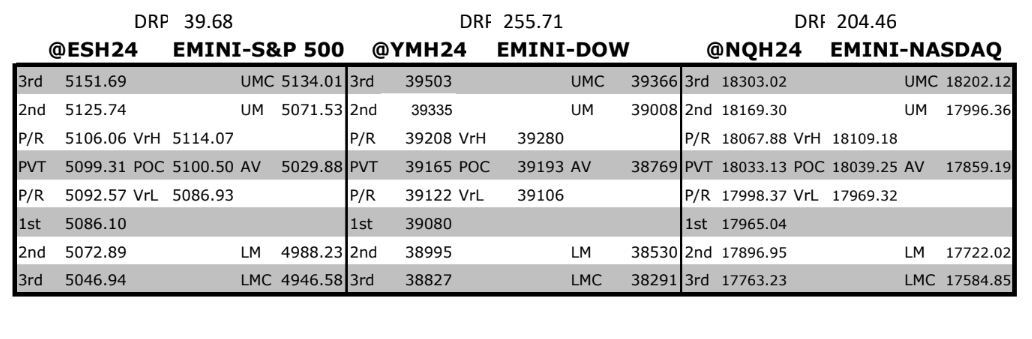
MrTopStep Levels:
MiM and Daily Recap
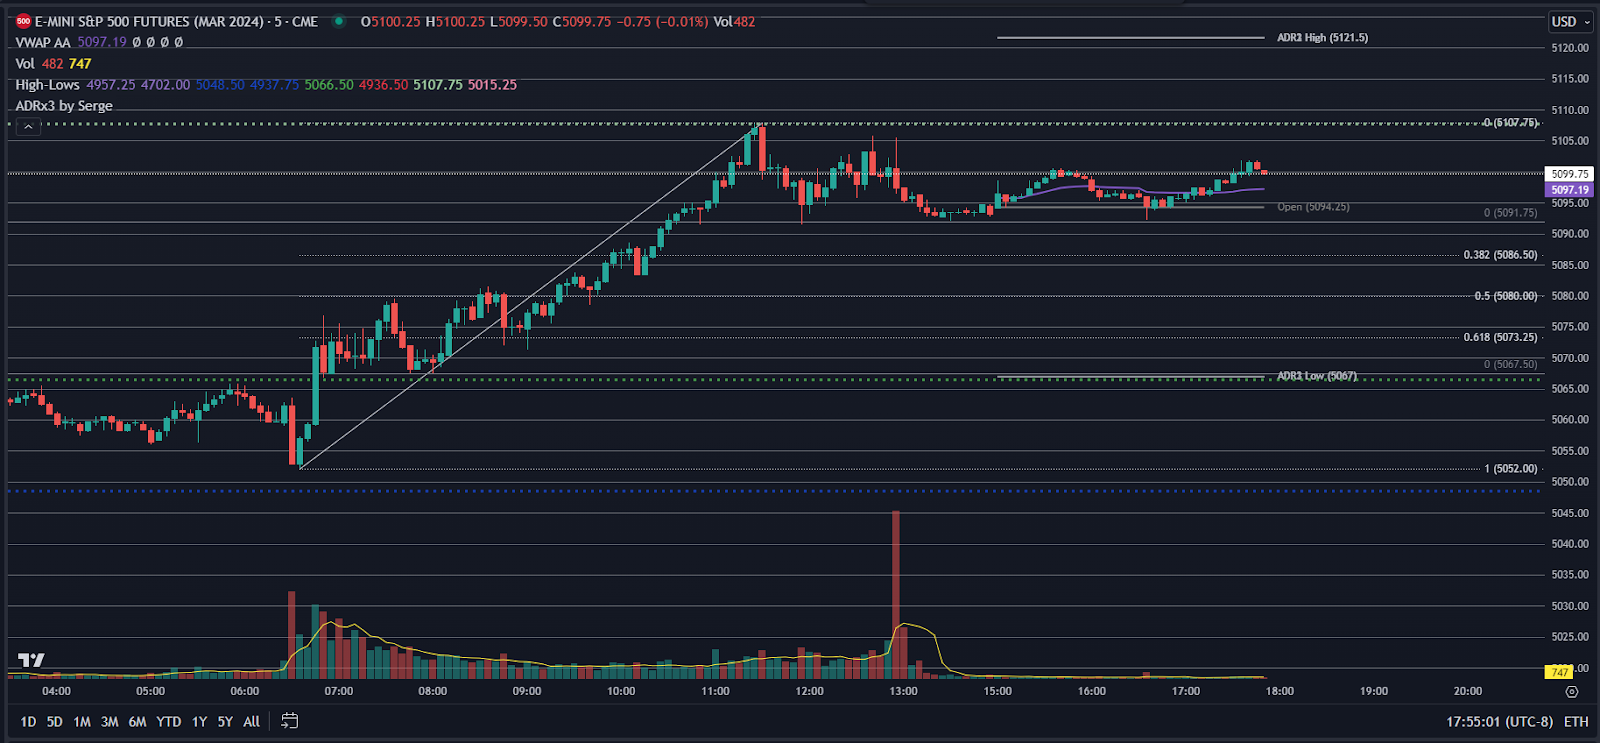
After Nvidia blew out earnings, the ES traded above its old contract high up to 5067.75 on Globex and opened Thursday’s regular session at 5062.25. After the open, the ES sold off down to the VWAP at 5052.50 at 9:37, traded up to 5066.50, dropped a few points, and then traded up to another new all-time historical high at 5067.75. From there, it pulled back to 5066.75 at 9:55 and then fell into a 5075.50 to 5086.25 back-and-fill for the next 40 minutes, popped up to 5079.00 at 10:35, pulled back to a 5067.50 double bottomed at 11:05, rallied up to 5081.50 at 11:37 and then pulled back to the 5071.25 at 12:02.
After the low, the ES stutter-stepped up to 5095.00 at 1:52, traded 5091.50 at 1:55, rallied up to 5107.75 at 2:30 and then traded back down to the 5091.50 level at 2:58. The ES then bounced back up to the 5105.75 at level at 3:43 as the early MIM was showing $594 million to buy and traded 5101.25 and the final 3:50 imbalance showed $496 million to sell and traded 4096.25 on the 4:00 cash close. After 4:00, the ES sold off down to 5093.50 at 4:17 and settled at 5001.75, up 82 points or +1.83%. The NQ settled at 18,069.50, up 368 points or +2.03%, the YM settled at 39,101.00, down 22 points or -0.06%, and the RTY settled at 2,013.10, up 12.60 points or +0.63%. The ZB settled at 118.09, up 38 ticks +0.32% and last but not least — and something most people don’t seem to be paying attention to — CL traded up to $78.92 and settled $78.34, down 27 cents.
In the end, it’s not just the stock market that’s moving, everything is. We may have to get used to the persistent low volumes. While the big down days do push the volumes up, it’s not like it used to be where a sustained down day could be anywhere from 1.8 million to 2.3 million contracts. In terms of the ES’s overall tone, it’s the same old slow declines and then right back up. In terms of the ES’s overall trade, volume was slightly higher than we have been seeing: 412k contracts traded on Globex and 1.138 million traded on the day session for a total of 1.550 million contracts traded.
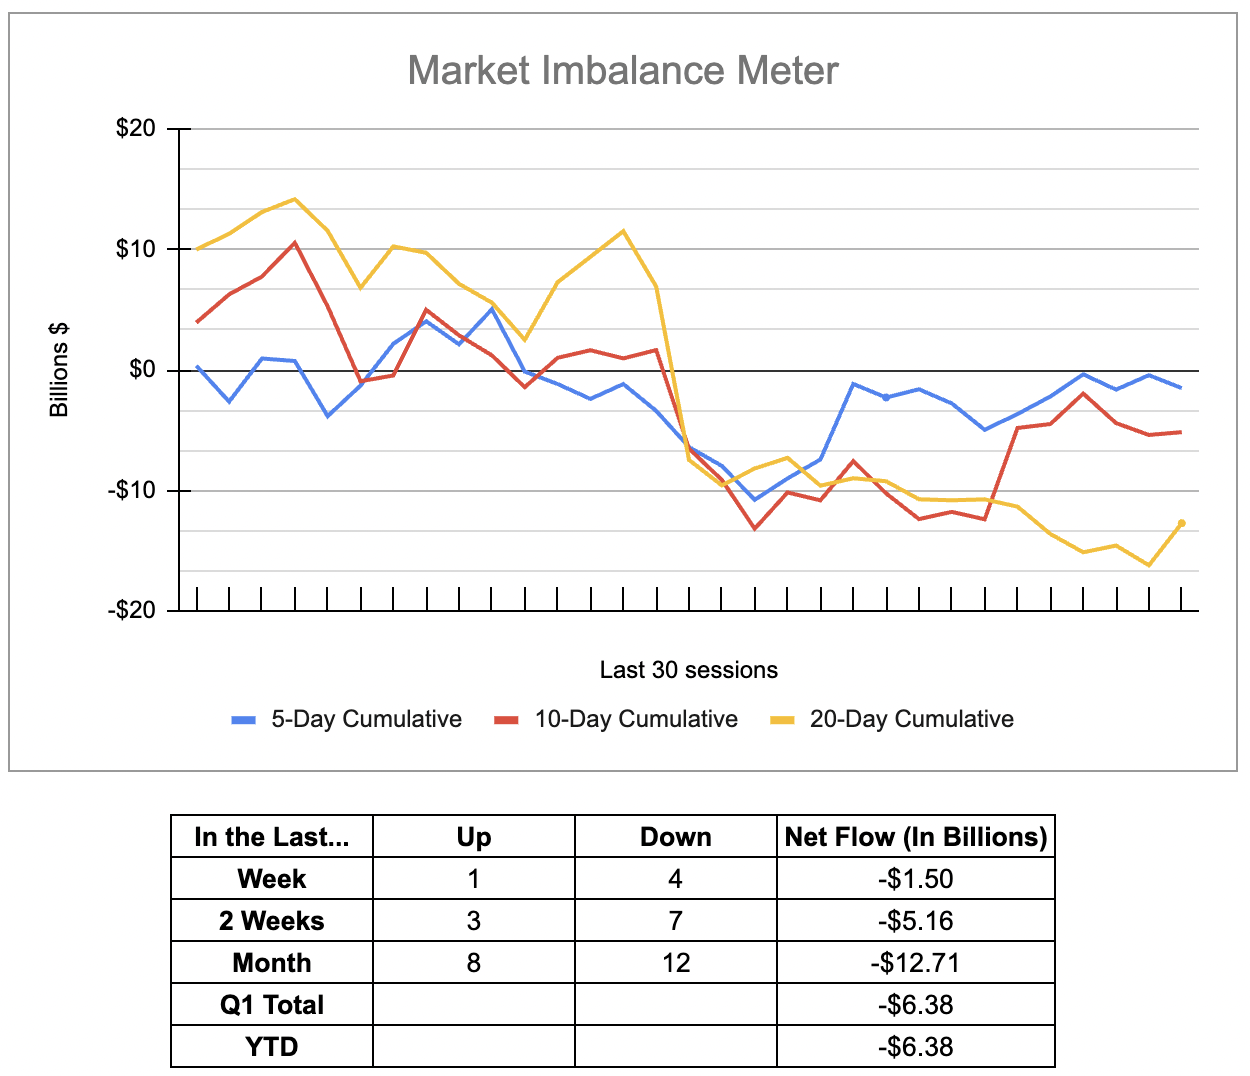
For more info on accessing the MIM, please visit here.
Technical Edge
-
NYSE Breadth: 56% Upside Volume
-
Nasdaq Breadth: 56% Upside Volume
-
Advance/Decline: 61% Advance
-
VIX: ~14
Guest Post
SpotGamma is one the the shining stars of the options markets. If you have never heard of them or already know of them and have never signed up for their options flow products or the SG Academy, I fully suggest you check them out and add them to your trader’s toolbox.
Here’s a snippet from them:
Today we see the SPY Call Wall at 408, which lines up with the SPX Call Wall at 5,100 to provide S&P500 market resistance. In the QQQ’s the Call Wall remains just above at 440, which has been the Call Wall strike for several weeks. The summary of this, we believe, is that the current index price area likely requires a bit of digestion before moving higher.
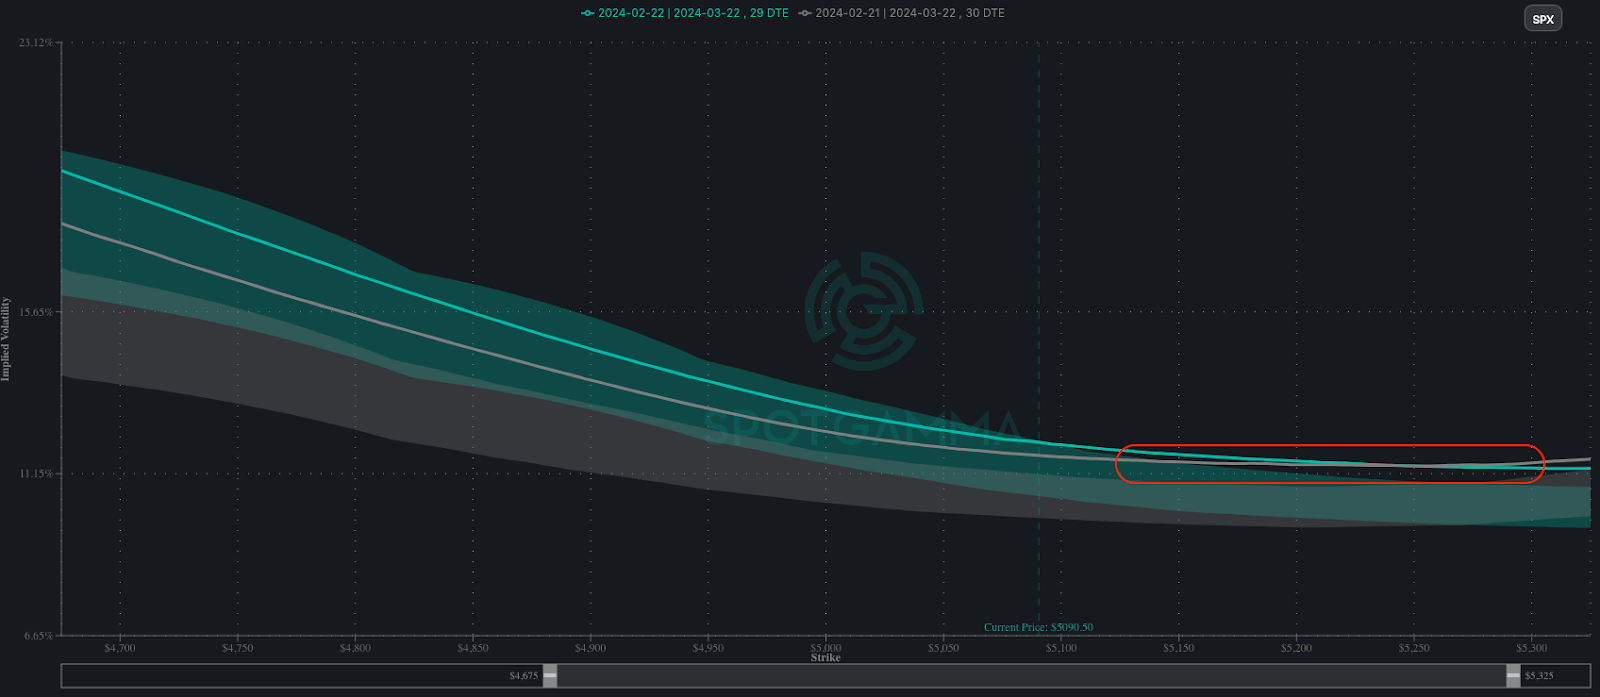
Looking at 1-month SPX skew we can see that upside strikes (i.e. calls) have relatively higher IV’s than at any time vs last several months, as shown by today’s skew plot (green line) being above the shaded cone (red box). However, the IV’s for upside strikes did not increase into yesterday’s 2% SPX rally, which is shown by the current skew (green line) staying flat to Tuesday’s close (gray line). This signals that S&P call buyers didn’t chase higher strikes into yesterday’s move.
Economic Calendar
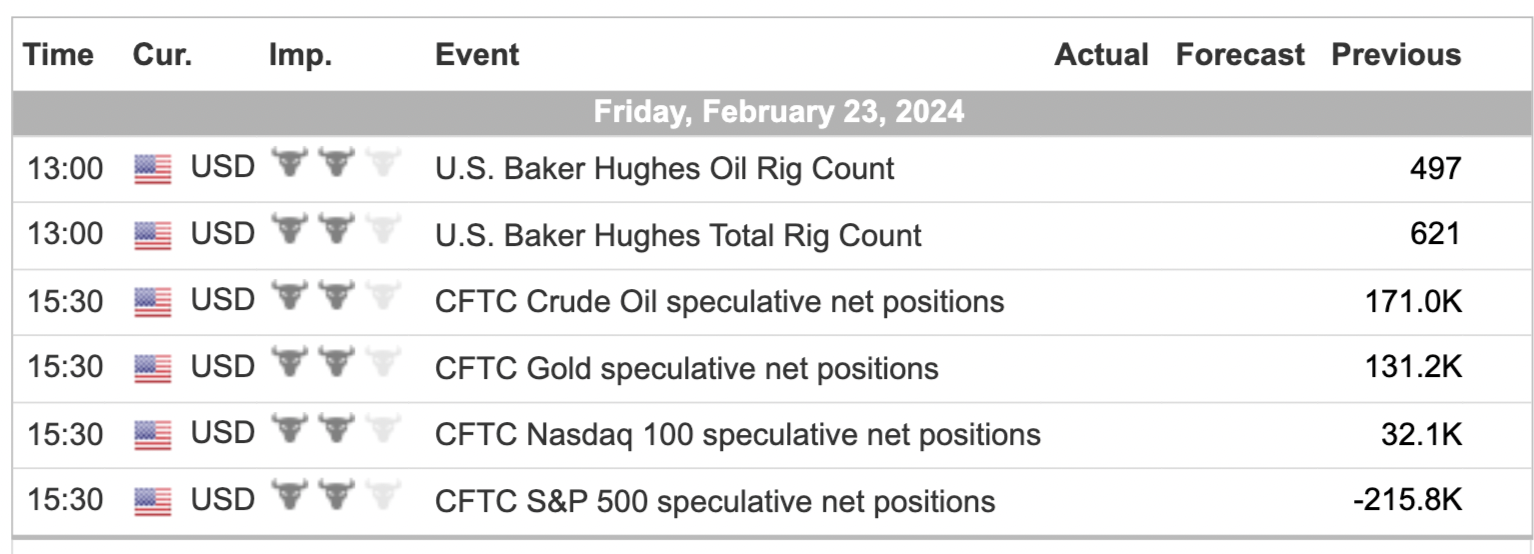
For a more complete Economic Calendar see: https://mrtopstep.com/economic-calendar/
Comments are closed