Weekly Winning Streak Could Come to an End
But that’s not necessarily bearish
Follow @MrTopStep on Twitter and please share if you find our work valuable!
Our View
I think the nine-week rally ends this week, but that doesn’t mean the ES isn’t going higher. As mentioned last week, the overall price action since last Wednesday has been institutions selling the big tech names and “smart money” taking money off the table.
Helping that idea is growing doubt that the big tech stocks that powered last year’s rally can keep going up. While there was a Nasdaq reweighting last year, it doesn’t seem to have cured the problem. The so-called Magnificent Seven stocks continued to make up a large percentage of the index.
Last year, the Mag 7 represented about 30% of the S&P 500’s market value and was responsible for much of the index’s 24% gain for the year.
I understand that we live in a new world trading order where nothing stays the same for very long, but with the big money piling into tech last year, the enthusiasm hasn’t dulled. I have always said that the new year — especially after a big move up or down — tends to adjust.
While I remain bullish, I also think some type of pullback is necessary.
Over the last couple of months, we have also seen what I call an algo blip. The ES is trending in its range, and out of the blue comes a 10 or 20-point drop. I think this has something to do with order flow, exhaustion, and the low level of bids. They are mini-algo washouts that generally recover quickly, but that’s not the pullback I am looking for. I have a feeling we get into some type of lower trading range and just chop up and down.
Our Lean
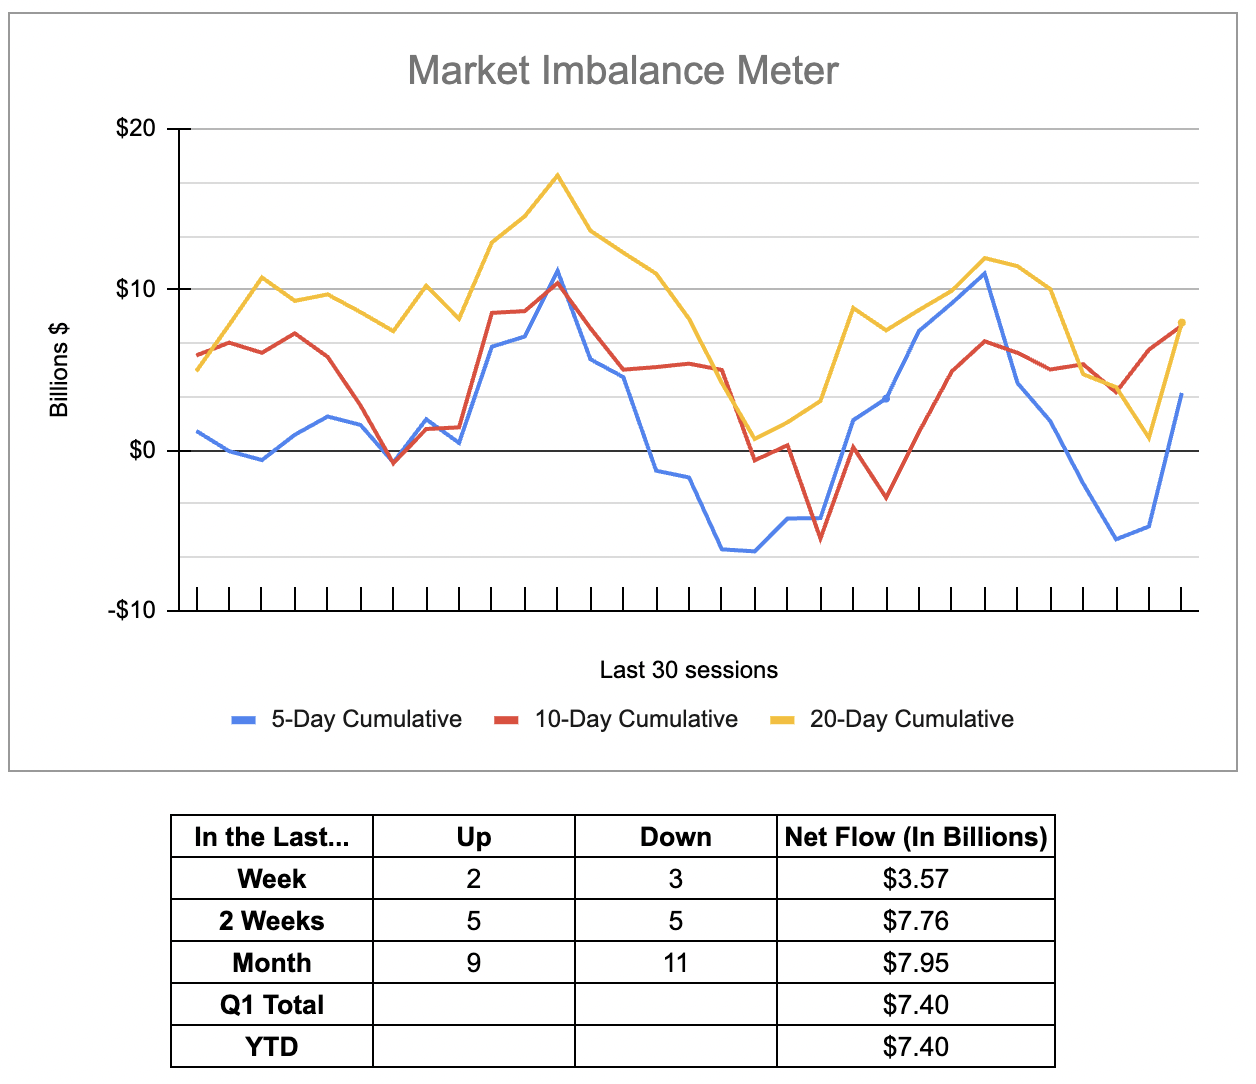
The second trading day of the year is very bullish. One would think with over $7 billion to buy on yesterday’s imbalance that we should see higher prices, but I don’t think it goes up without some pullbacks/selling.
The key to today is the same as yesterday. If there is more tech selling, then the ES will struggle and if there isn’t then we could see an early pop. Since last Thursday’s high, the NQ has fallen over 550 points.
For those of you who like HandelStats levels, here they are:
-
Upside: Trade and hourly close above 4767 targets 4775.12, then 4777.62, then 4783.25. Hourly close above there targets settlement at 4788. Hourly close above there targets 4799.88**. Hourly close above there targets 4802.12, then 1sd at 4816.12. Hourly close above there targets 4820.75, 4824, 4825.50. Hourly close above 4830.25, then 4835.25. Hourly close above there targets 4837, then 4838.75, then 4841.24, then 2sd at 4844.24.
-
Downside: Trade below 4767 targets 4765, then 4763.25. Hourly close below 4763.25 targets -1sd at 4759.88. Hourly close below there targets -1sd weekly at 4756.20, then 4755.51. Hourly close below there targets 4742.25, hourly close below there targets -2sd at 4731.76, then 4726.88, hourly close below there targets -3sd at 4703.64.
MiM and Daily Recap
ES Recap
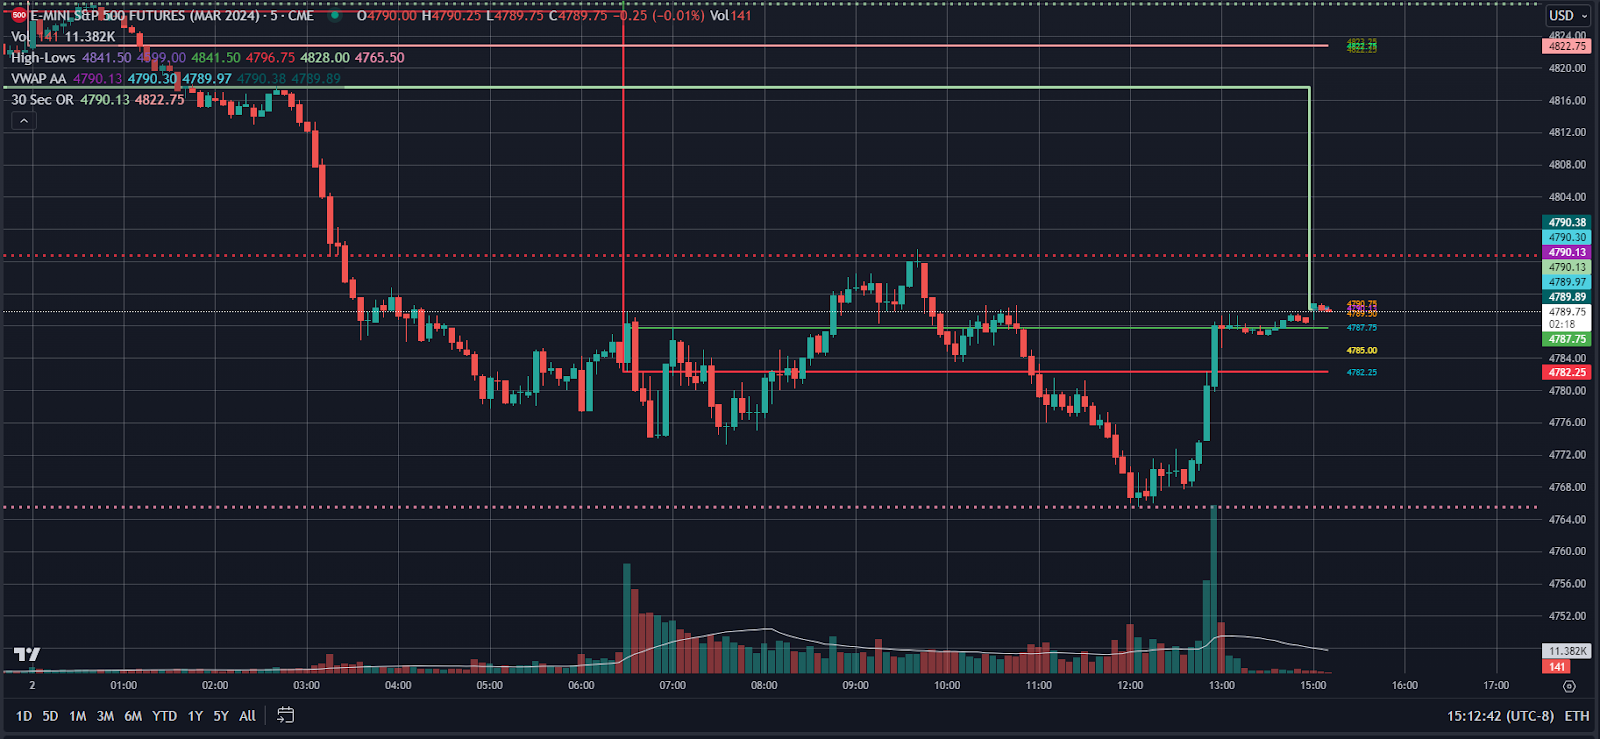
The ES sold off down to 4777.75 on Globex after Barclays downgraded AAPL — which fell 3.6% on the day — and opened Monday’s regular session at 4783.50. After the open, the ES rallied up to 4789.75, sold off down to 4774.00 at 9:50, rallied up to the 4787.75 level at 10:05 and sold off down to a new low at 4773.50 as the continued liquidation in the tech sector weighed on stocks. After the low, the ES caught a bid and short-covered up to the 4794.50 level at 12:09. After that high, more NQ sell imbalances showed up and pushed the ES back below the VWAP at 4788.25.
From there, the ES was able to push back up a new high at 4797.50 at 12:42, sold off down to 4783.50, back-and-filled in a 3 to 5 point range at the VWAP and then dropped down to a new low at 4765.50 at 3:08 as the early imbalance showed over $1.3 billion to buy. After the low, the ES traded in a narrow back-and-fill and then traded up to 4773.75 as the 3:50 cash imbalance showed $7.4 billion to buy. It rallied up to 4788.00 at 3:59 and traded at 4785.00 on the 4:00 cash close. After 4:00, the ES traded up to 4789.50 and traded 4787.25 on the 5:00 futures close, down 32.75 points or 0.68% on the day.
In the end, the unrest in the Middle East and the Barclays Apple downgrade pushed the NQ down more than 300 points. In terms of the ES’s overall tone, it was weak. In terms of the ES’s overall trade, Globex volume was high at 299k and day session volume was 1.252 million for a total of 1.551 million contracts traded.
Technical Edge
-
NYSE Breadth: 43% Upside Volume
-
Nasdaq Breadth: 46% Upside Volume
-
Advance/Decline: 47% Advance
-
VIX: ~13.75
ES
Levels from HandelStats.com

ES Daily
-
Upside: Trade and hourly close above 4767 targets 4775.12, then 4777.62, then 4783.25. Hourly close above there targets settlement at 4788. Hourly close above there targets 4799.88**. Hourly close above there targets 4802.12, then 1sd at 4816.12. Hourly close above there targets 4820.75, 4824, 4825.50. Hourly close above 4830.25, then 4835.25. Hourly close above there targets 4837, then 4838.75, then 4841.24, then 2sd at 4844.24.
-
Downside: Trade below 4767 targets 4765, then 4763.25. Hourly close below 4763.25 targets -1sd at 4759.88. Hourly close below there targets -1sd weekly at 4756.20, then 4755.51. Hourly close below there targets 4742.25, hourly close below there targets -2sd at 4731.76, then 4726.88, hourly close below there targets -3sd at 4703.64.
NQ

NQ Daily
-
Upside: Trade and hourly close above 16609.25 targets 16652.12. Hourly close above there targets 16695, hourly close above there targets settlement at 16727.50. Hourly close above there targets 16823.50. Hourly close above there targets 16851.38, then 1sd at 16873.28. Hourly close above there targets 16915.75**. Hourly close above there targets 17008.
-
(Daily close above there turns the up move back on).
-
-
Downside: Trade and hourly close below 16607 targets -1 sd at 16581.72, hourly close below there targets 16537.62, then 16492, 16480.62 and 16469.25. Hourly close below there targets -2sd at 16435.94. Hourly close below there targets 16366.12. Hourly close below there targets -2sd weekly at 16300.65.
Economic Calendar

Comments are closed