What Happens When You Snap a 9-Week Win Streak?
Jobs Day.
Follow @MrTopStep on Twitter and please share if you find our work valuable.
Our View
I asked Rich Miller from @HandelStats a simple question: What happens after a 9-week rally.
After digging into the stats back to 1970, the conclusion was mixed. There were not a lot of big selloffs, and when there were some selloffs, there was also buying that offset the dips.
The study did show that the last quarter of the year tends to be the strongest, but there were no significant letdowns.
So what does that mean? Again, no one knows for sure what the ES or NQ is going to do next, but there are clear seasonal patterns that exist. It used to be that traders had to worry about September and October, but that seems to have shifted to the end of July and August.
Our Lean
If the ES sells off after today’s jobs number with Globex volume of 300k to 350k I want to buy the open of the first drop after the lower open, and hold all day. If the ES gaps higher I would look to sell the early rallies. If neither is correct I will recess. Remember trades and buses have a lot in common, if you miss one another will come along. As always trade less, pick your spots better, and use stops.
For those of you who like HandelStats levels, here they are:
-
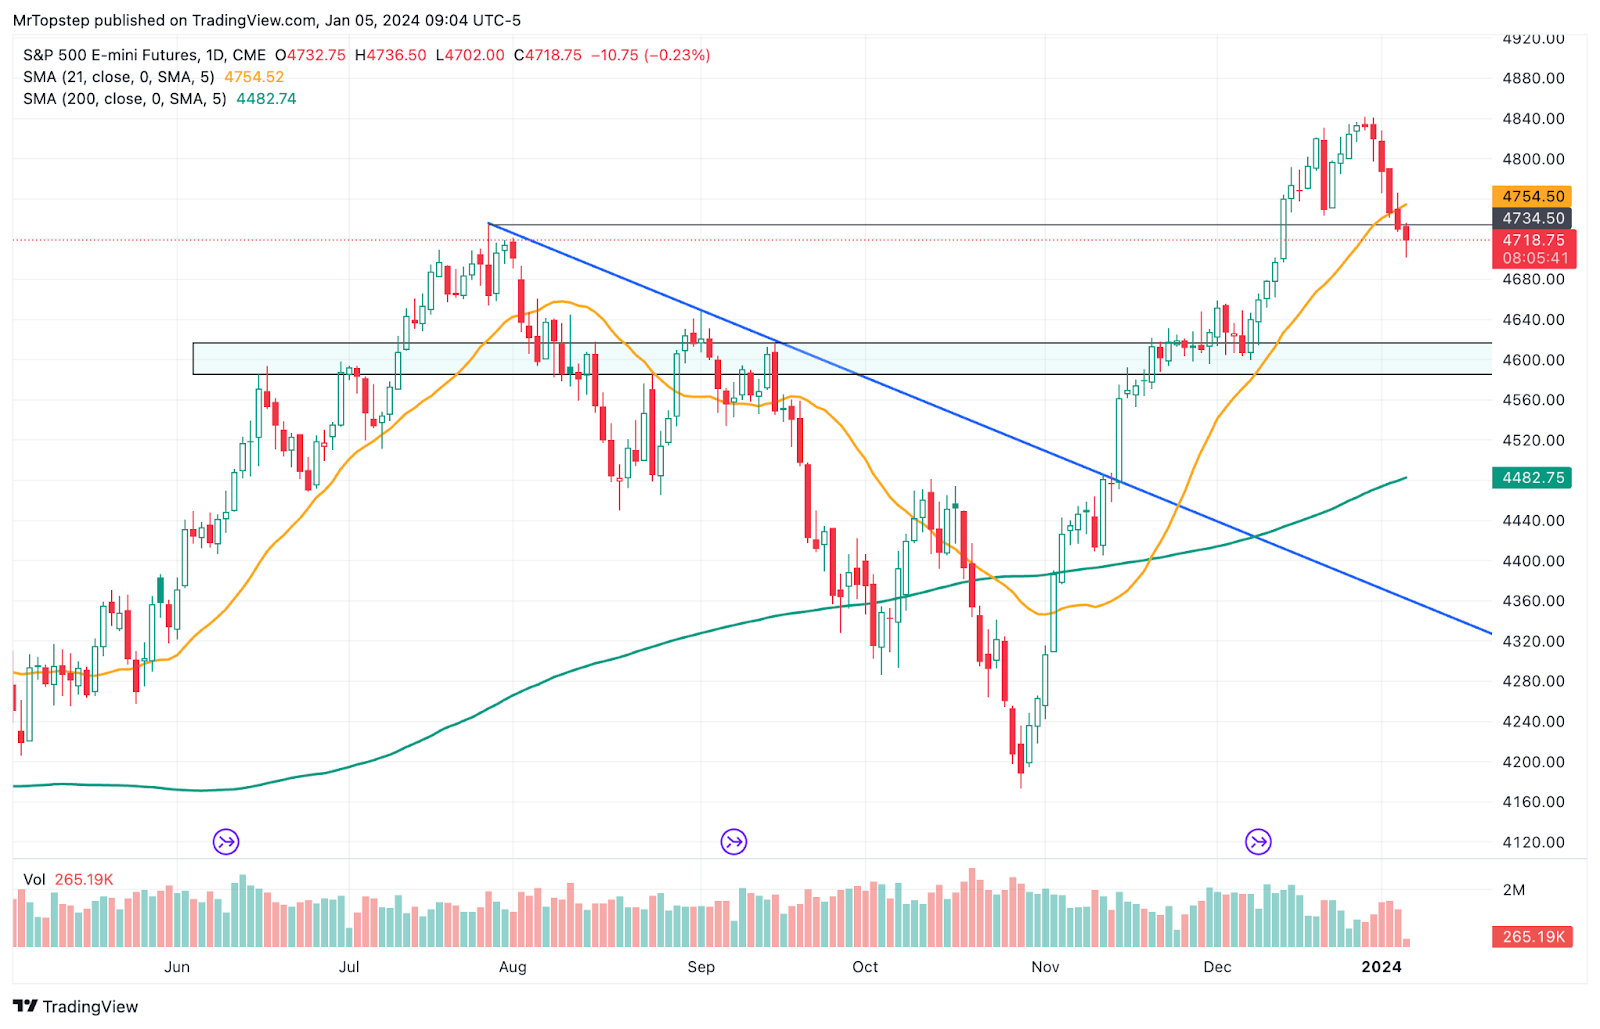
Upside: Trade and hourly close above 4716.50 targets 4724.25, then settlement at 4728.75, then 4732. Hourly close above there targets 4740.88. Hourly close above there targets 4750.50. Trade above there targets 4755.51, then 1sd at 4758.58. Hourly close above there targets 4766.50, 4767. Trade and hourly close above there targets 4775.12, then 4783.25, trade above there targets 2sd at 4788.40. Hourly close above there targets 4799.88**, then 4802.12, hourly close above there targets 3sd at 4818.23.
-
Downside: Trade and hourly close below 4716.50 targets 4701.75, -1sd weekly at 4698.91. Trade below targets 4691.62, then 4683.50, then 4679.75, hourly close below there targets 4668.38, then -2sd at 4669.10. Hourly close below there targets 4656.75, then 4650.25, then -3sd at 4639.27.
MiM and Daily Recap

ES Recap 15-min
The ES traded down to 4737 on Globex early Thursday morning and opened the regular session at 4739.75. After the open, the ES traded 4737.75, rallied up to the VWAP at 4747.50 and for the next 30 minutes traded in a 4 to 7-point back-and-fill at the VWAP, made one last stab down to a higher low at 4738.50 at 10:00:38 — remember, PitBull says to watch the half houses for buy and sell programs — and then rallied up to 4758.50 at 10:16.
The ES fell into another back-and-fill pattern above the VWAP from 4752.00 to 4759.25 until 11:00. That’s when the ES started running more buy stops and buy programs that pushed the future up to a 4766.50 double top at 11:29 and then sold back off below the VWAP down to 4749.00 at 12:04, back-and-filled just above and just below the VWAP and then sold off down to a new daily low at 4743.00 at 12:49. After the low, the ES fell into another back-and-fill pattern under the VWAP, traded up to 4751.00 at 1:51 and then went offered again as the NQ reversed lower and traded down to 4737.00 at 3:30 as the early NYSE stock imbalance showed $1.35 billion to sell.
Throughout the day, breadth was never that bad. The ES traded back up to 4742.00 at 3:47, traded down to 4735 as the final 3:50 imbalance showed $4 billion to sell, and traded down to a new low at 4727.00 at 3:54 and traded 4730.00 on the 4:00 cash close. After 4:00, the ES rallied up to 4733.50 and settled at 4732.25 on the 5:00 cash close, down 18.5 points or 0.35% on the day.
In the end, it was another day of failed rallies. In terms of the ES’s overall trade, volume was low: 232k traded on Globex and 1.067 million traded on the day session for a total of 1.299 million contracts traded.

Technical Edge
-
NYSE Breadth: 50% Upside Volume
-
Nasdaq Breadth: 45% Upside Volume
-
Advance/Decline: 49% Advance
-
VIX: ~14.25
ES
Levels from HandelStats.com
ES Daily
-
Upside: Trade and hourly close above 4716.50 targets 4724.25, then settlement at 4728.75, then 4732. Hourly close above there targets 4740.88. Hourly close above there targets 4750.50. Trade above there targets 4755.51, then 1sd at 4758.58. Hourly close above there targets 4766.50, 4767. Trade and hourly close above there targets 4775.12, then 4783.25, trade above there targets 2sd at 4788.40. Hourly close above there targets 4799.88**, then 4802.12, hourly close above there targets 3sd at 4818.23.
-
Downside: Trade and hourly close below 4716.50 targets 4701.75, -1sd weekly at 4698.91. Trade below targets 4691.62, then 4683.50, then 4679.75, hourly close below there targets 4668.38, then -2sd at 4669.10. Hourly close below there targets 4656.75, then 4650.25, then -3sd at 4639.27.
NQ
NQ Daily
-
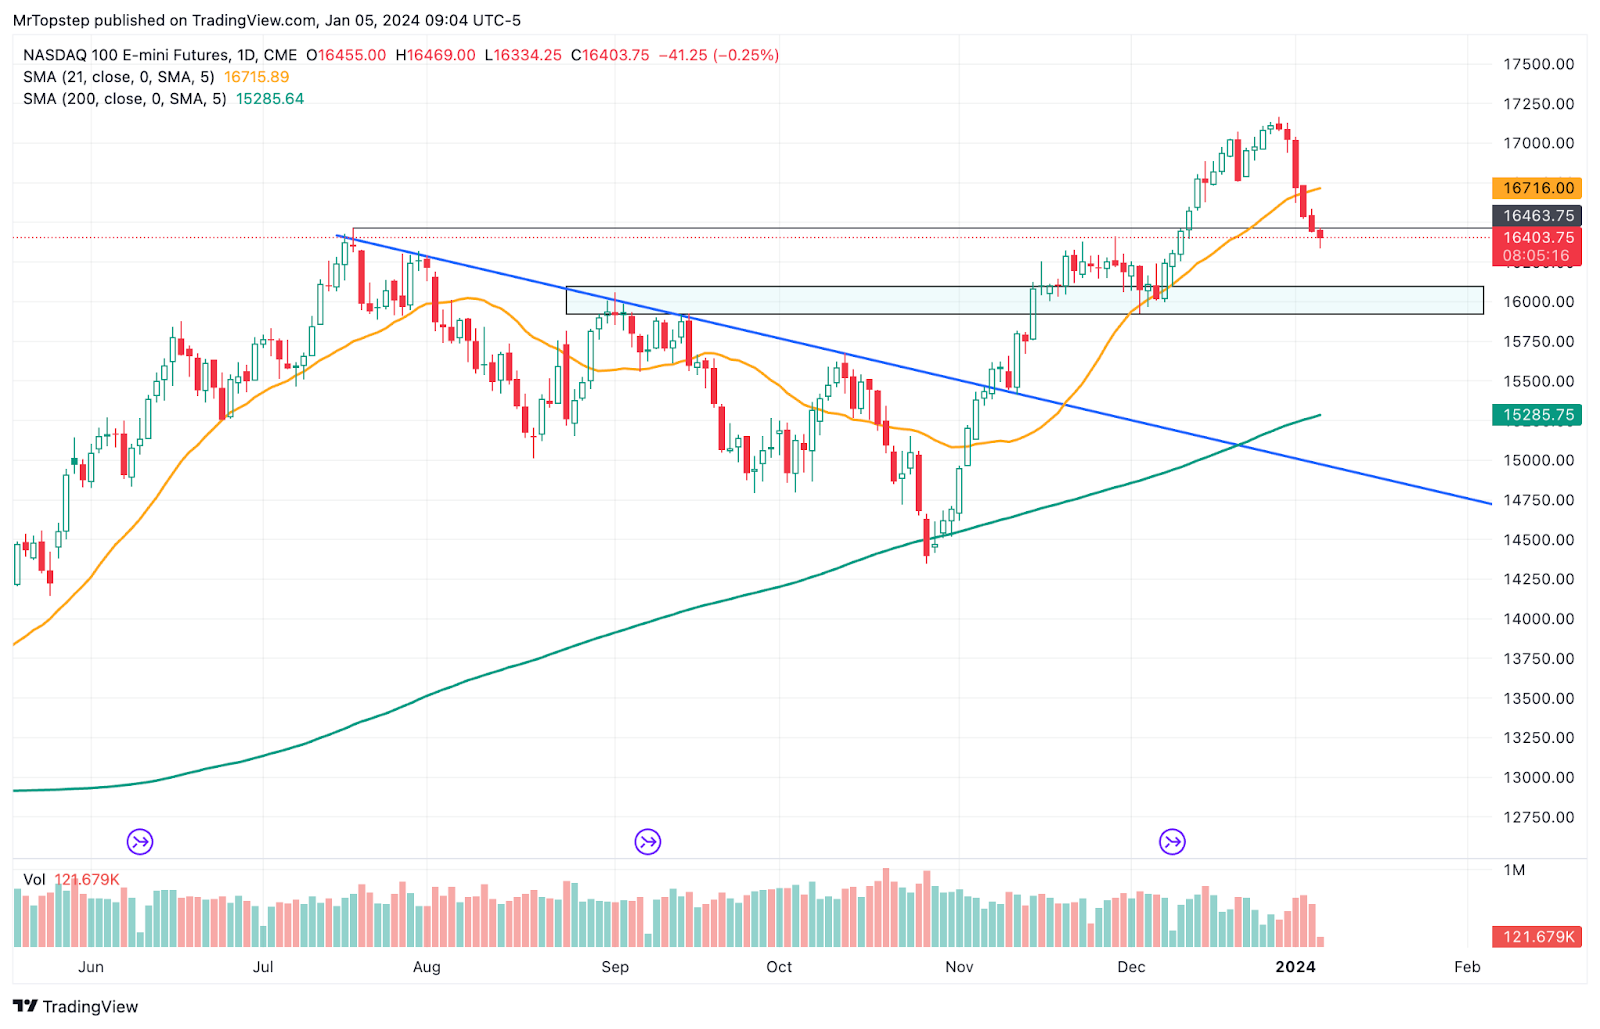
Upside: Trade above 16392.25 targets 16417.25, then settlement at 16438.75, then 16442.25. Hourly close above there targets 16495.62, then 16519.25, then 16549. Hourly close above there targets 1sd at 16585.20. Hourly close above there targets 16608.35, then 16621.75, then 16634.70, then 16652.12. Hourly close above there targets 16695, then 2sd at 16731.64.
-
Downside: Trade below 16392.25 targets 16366.12. Hourly close below there targets weekly -2sd at 16300.65, -1sd at 16292.30, then 1289.75, then 16276.38, then 16263. Hourly close below there targets 16197, hourly close below there targets -2sd at 16145.86. Hourly close below there targets 16050.40, then 16023.50, 16012.50, and -3sd at 15999.41.
Economic Calendar

Comments are closed