Can the Bulls Muster Up Another Bounce?
Oh yeah — and turn off the news!
Follow @MrTopStep on Twitter and please share if you find our work valuable!
Our View
On one side we have two wars going on, soaring interest rates, inflation, and skyrocketing debt. On the other side, we have a strong jobs market and economy.
I have to be completely honest, I am 100% sure that many of you think I go too far sometimes and I’ll agree with that. But we get blasted all day and all night by CNN, FOX, Bloomberg, BBC, and whoever else. News from Ukraine, news from Russia, news from Gaza, Iran, North Korea and wherever else.
If you went to a deserted island I think you would still find a headline or two!
What I’m saying is that we get bombarded all day and night with news and headlines. I have a news app on my phone that spins current headlines super fast and like I told the PitBull and my friend Joel during Covid: “TURN OFF FOX TV.”
PitBull just has 4 widescreen TVs and Joel has speakers hooked up to his TV and FOX is blasting in the kitchen, his bedroom and the TV room, it’s insane. I almost feel that I should unhook the news app and not watch any news like I did during the COVID-19 pandemic.
Bottom line — I don’t think being overly connected is a good thing, especially right now.
Our Lean
Our lean is simple — it’s for higher prices.
You can sell the early rallies and buy the pullbacks or just be patient and buy the pullbacks. There are still tons of buy stops to run.
For those of you who like HandelStats levels, here they are:
-
Upside: Trade and hourly close above 4194.75 targets 4207.85, then 1 sd at 4224.26. Hourly close above there targets 4236.44, hourly close above there targets 4258.50, then 2 sd at 4262.
-
Downside: Trade and hourly close below 4194.75 targets 4:15 settlement at 4186.50, below there 4183.25, then 4171.75. Hourly close below there targets 4166, then 4152.50. Hourly close below there targets -1 sd at 4148.74, then 4120.75, then -2 sd at 4110.99.
MiM and Daily Recap

ES Recap 15-min
The ES traded 4176.75 on Globex and opened Monday’s regular session at 4165.75. After the open, the ES rallied up to 4184.00 at 9:54, pulled back and fell into a big 4161.50 to 4155.25 back-and-fill from 10:29 to 10:42, printed a new low at 4152.00 at 10:45 and then rallied up to 4170.75 at 11:12. From there, it sold off down to a higher low at 4154.25 at 11:24, rallied up to 4173.00 at 12:14, dropped down to 4156.25 at 1:30 and then rallied up to 4185.25. After the run-up, the ES pulled back to 4178.75 at 2:05, had a small pullback to 4180.50 and then started hitting buy stops above 4187.50 up to 4194.50 at 3:01.
Throughout the day there were several periods of back-and-fill that occurred after all the pullbacks. Generally, that means a string close. The ES traded up to 4197.50 at 3:25 as the early imbalance showed small to buy. The ES traded 4190.50 as the 3:50 cash imbalance showed $565 to buy, traded 4186 on the 4:00 cash close and traded 4185 on the 5:00 futures close, up 48 point or 1.16% on the day.
In the end, it was a day of buy stops, buy programs, and short-covering rallies. In terms of the ES’s overall tone, it was firm but the day didn’t go without some dumps. In terms of the ES’s overall trade, volume was steady: 244k traded on Globex and 1.583 million traded on the day session for a total of 1.827 million contracts traded.

Technical Edge
-
NYSE Breadth: 61% Upside Volume
-
Nasdaq Breadth: 67% Upside Volume
-
Advance/Decline: 68% Advance
-
VIX: ~19.25
ES
Levels from HandelStats.com

ES Daily
-
Upside: Trade and hourly close above 4194.75 targets 4207.85, then 1 sd at 4224.26. Hourly close above there targets 4236.44, hourly close above there targets 4258.50, then 2 sd at 4262.
-
Downside: Trade and hourly close below 4194.75 targets 4:15 settlement at 4186.50, below there 4183.25, then 4171.75. Hourly close below there targets 4166, then 4152.50. Hourly close below there targets -1 sd at 4148.74, then 4120.75, then -2 sd at 4110.99.
NQ

NQ Daily
-
Upside: Trade and hourly close above 14426.75 targets 14553.62, then 14588.25. Hourly close above there targets 14654, then 2 sd at 14758.51.
-
Downside: Trade and hourly close below 14426.75 targets 4:15 settlement at 14418, then 14385.62, then 14344.50, then 14331.25. Hourly close below there targets -1 sd at 14247.75. Hourly close below there targets 14159.25.
Guest Post — Bert Dohmen’s Wellington Letter
To Be Used As Contribution to Mr. Top Step’s Opening Print Newsletter:
“CELEBRATING our 47th YEAR of UNSURPASSED FORECASTS”
October 29, 2023
Market Deterioration Accelerates
DECEPTIONS
This year has been the “Year of Great Deceptions,” as we have frequently pointed out. The market has been deceptively promoted as having big gains in 2023. The media simply use the mild gains of the S&P 500, which is a cap weighted index. Beware of financial TV bias!
We continue to warn of the deceptive and false info spread by financial media.
We hear all the time that the market boomed this year and “defensive investors” who were cautious would have missed a great opportunity. That is so false!
Investors were not told the truth, except by us and some other private analysts, that all the gains in the S&P 500 were due to just 7 stocks (the “Magnificent 7”) out of the 500 stocks in the index. The other 493 S&P stocks together were flat. What a scam!
We have repeatedly shown the chart of the “equal weight” S&P (SPEW Index), where each stock has the same weight regardless of the capitalization of the firm.
Here is a weekly chart going back to the October 2022 lows comparing the two indices. The cap-weighted S&P 500 (blue line) is back to the same level it was in May of this year. However, the equal weighted S&P 500 (SPEW Index, red line) is now trading at a new low for the year and is back to the same level it was at over one year ago!

The important thing is to focus on the big trend instead of day-to-day chop when it occurs. There is an old motto, “the trend is your friend.”
Below is the 2-day chart of the above comparison since the start of this year. The S&P 500 (candlesticks) hit another mild Fibonacci support level last Friday (October 27, 2023). That may produce a bounce.

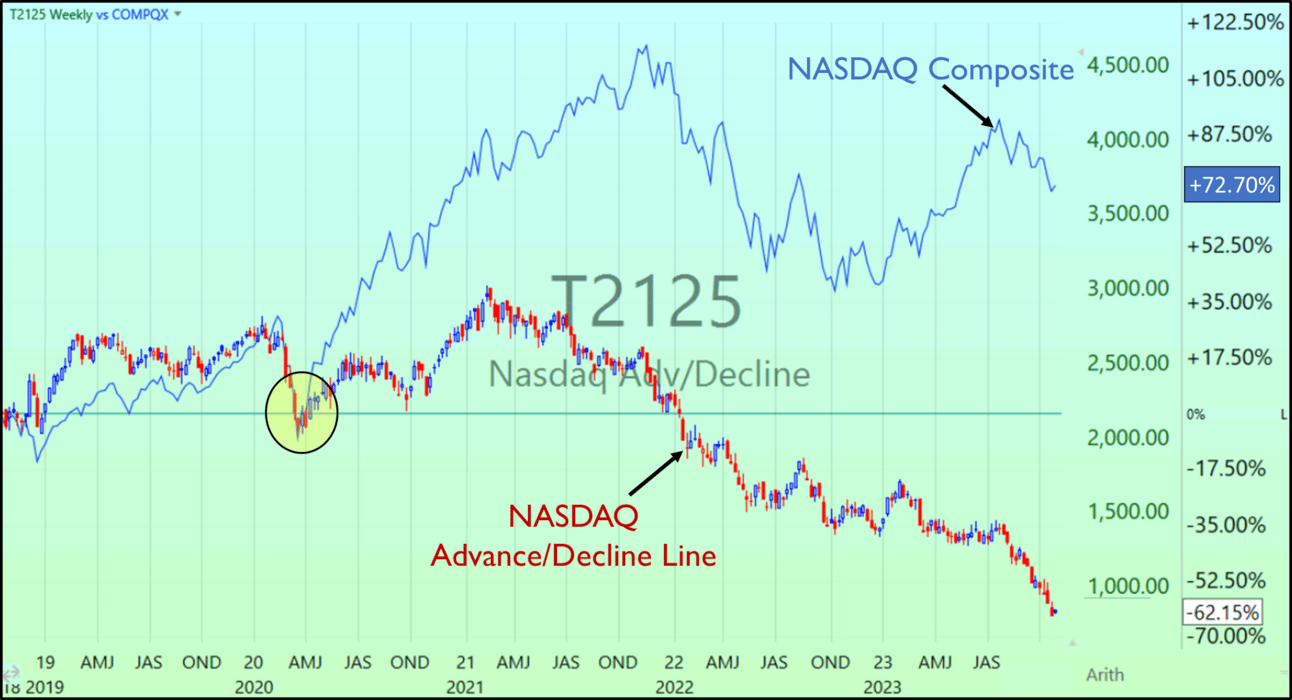
The chart of NASDAQ (blue line) vs. the advance/decline ratio of the NASDAQ (candlesticks) also clearly shows that the majority of tech stocks (the A/D line) have been declining significantly. That doesn’t look like a bull market, although some analysts still insist that you must “buy stocks now in order not to miss the next up-move.” Really?!
To further illustrate just how poorly the broader group of tech stocks have performed, we look at weekly chart of the “% of NASDAQ Comp Stocks Above Their 200-day M.A.” indicator below. On Friday, October 27th it fell to just over 24% of NASDAQ stocks above their 200-day m.a.
Look at this chart carefully as it shows what many techs stocks have been doing this year. It cannot easily be manipulated. For us that means that about 76% of stocks are in bear markets.
Notice how it broke support from its March lows in early October (light blue horizontal line) and has continued to plunge over the past 4 weeks. We should see the indicator eventually fall to the June 2022 lows (red horizontal line, “x”) before any sort of stronger support comes in.

Now we’ll look at how the broader stock market (NYSE) has been performing with the weekly chart of the “% of Stocks Above Their 200-day M.A.” indicator below. Notice how it also broke support from its March lows recently (light blue horizontal line).
Currently just over 24% of stocks on the NYSE are trading above their 200-day m.a., similar to the NASDAQ above. We would expect to see this indicator eventually fall to the red horizontal support line (“x”), which is the June-October 2022 lows.
CONCLUSION: For weeks we have said in our Wellington Letter as well as in our shorter-term trading services (Smarter Stock Trader and Fearless ETF Trader) that the chart patterns and the heavy selling strongly suggest that the next declining phase of the market could be severe, even worse than the one we saw in 2022.
This is a time to ignore some of the manipulated short-term bounces of a few individual stocks, as well as the opinions of the bulls who work for money management firms. They have serious conflicts of interest. We suggest focusing on the major trends of the most relevant market indices. The short-term pops are designed to distract.
While the financial media and money managers proclaim stocks have had a good year this year, the major market indices have been slicing through important support levels almost like a hot knife through butter.
This will probably lead to a sharp market plunge as the bullish money managers give up. They will sell all their big losers before year-end in order not to show them in their year-end reports to their clients.
Wishing you successful investing,
Bert Dohmen and team
Economic Calendar

Disclaimer: Charts and analysis are for discussion and education purposes only. I am not a financial advisor, do not give financial advice and am not recommending the buying or selling of any security.
Remember: Not all setups will trigger. Not all setups will be profitable. Not all setups should be taken. These are simply the setups that I have put together for years on my own and what I watch as part of my own “game plan” coming into each day. Good luck!
Update your email preferences or unsubscribe here
© 2023 The Opening Print
228 Park Ave S, #29976, New York, New York 10003, United States
No responses yet