CPI Report Is in Focus
Bulls remain in control
Follow @MrTopStep on Twitter and please share if you find our work valuable!
Our View
In the new world trading order, it’s all about the rotation of the day.
Some of these rotations only last a day or two. Some last weeks. But rest assured, there is some type of rotation going on every day. Earlier this week, remember how the NQ was ripping higher and the RTY was down 1.5% —- rotation.
Yesterday the RTY sold off again while the ES was trading well above 4800.00 and the bonds were down — rotation.
I generally just look at the index, not the particular stock sector, but tech is the big one. I think it would be a good idea to make a spreadsheet of the ES, NQ, YM, RTY, and the bonds and keep track of it. If the ES keeps going up, will there be more rotation out of the Russell? And what happens when the ES and NQ are being sold? Would that be a good time to buy the RTY?
The answer is in the price action.
Is everyone short? Is it holding key levels? Can you see the bids? Are there buy programs coming in on the half-hour? Is it back and filling?
Because I trade both the ES and NQ, I am acutely aware of which one is being bought or sold aggressively. Yesterday it looked like the ES was outperforming the NQ, but that reversed after the early sell-off.
What I’m saying is, not everyday but most days, there is an agenda — seeing and distinguishing what’s more bid or what’s more offered. In short…Like I have always said, we are not here to fight city hall and if the ES (or NQ) is going up or down I want to go for the ride.
Our Lean
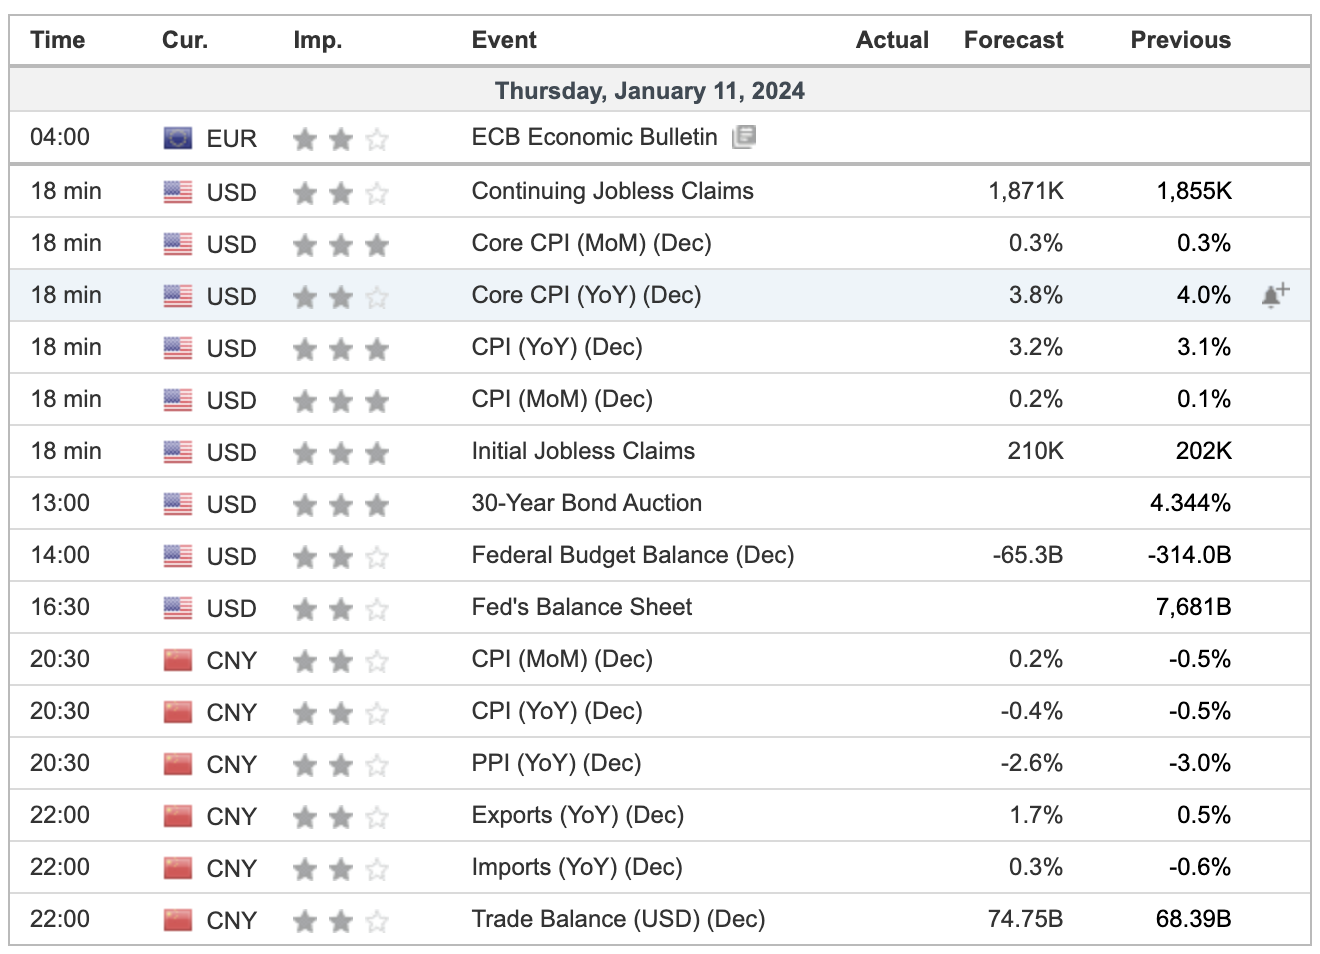
If today’s CPI number comes in better than expected, the index markets will have another reason to go up. If the number isn’t any good and the ES sells off, it will rally again.
Bank of America anticipates overall goods prices to continue to fall outright, thanks in part to cheaper used cars and trucks. Services on the other hand, might continue to rise at a still-elevated pace, they say, due to persistently high rents in the CPI data.
“Much of the disinflation in recent months has been driven by deflation in core goods prices.” But they add that core services excluding housing — a key focus for the Fed — have shown “some progress, but the current run-rates remain above pre-pandemic levels.”
Lots of talk about today being a down day. It may be, but as I said above, the ES had a 140-point pullback which I believe was a positive for the ES and NQ after such a large rally, and are now resuming their uptrend in search of new all-time highs.
There are a lot of buy stops above and if the ES catches a bid above 4831.00, I think 4860 comes into play. I am going to continue to buy the pullbacks and hold my long ES position into FRYdays options expiration. That doesn’t mean you can’t sell an early rip, but I’m staying with the trend that says you are supposed to buy the pull backs.
For those of you who like HandelStats levels, here they are:
-
Upside: Trade and hourly close above 4826 targets 4830.25, then 4835.25, then 4838.75, hourly close above there targets 1sd at 4846.52. Hourly close above there targets 2sd weekly at 4864.96, then 4870.80, then 2sd at 4873.53. Hourly close above there targets 4900.55.
-
Downside: Trade below 4826 targets settlement at 4819.50. Hourly close below there targets 4808.75, then 1sd weekly at 4800.98. Hourly close below there targets 4793, -1sd at 4792.48. Hourly close below there targets 4789, then 4784.50, hourly close below there targets 4769.62, then -2sd at 4765.47. Hourly close below there targets 4757.88, then 4749.50, then -3 sd at 4738.45.
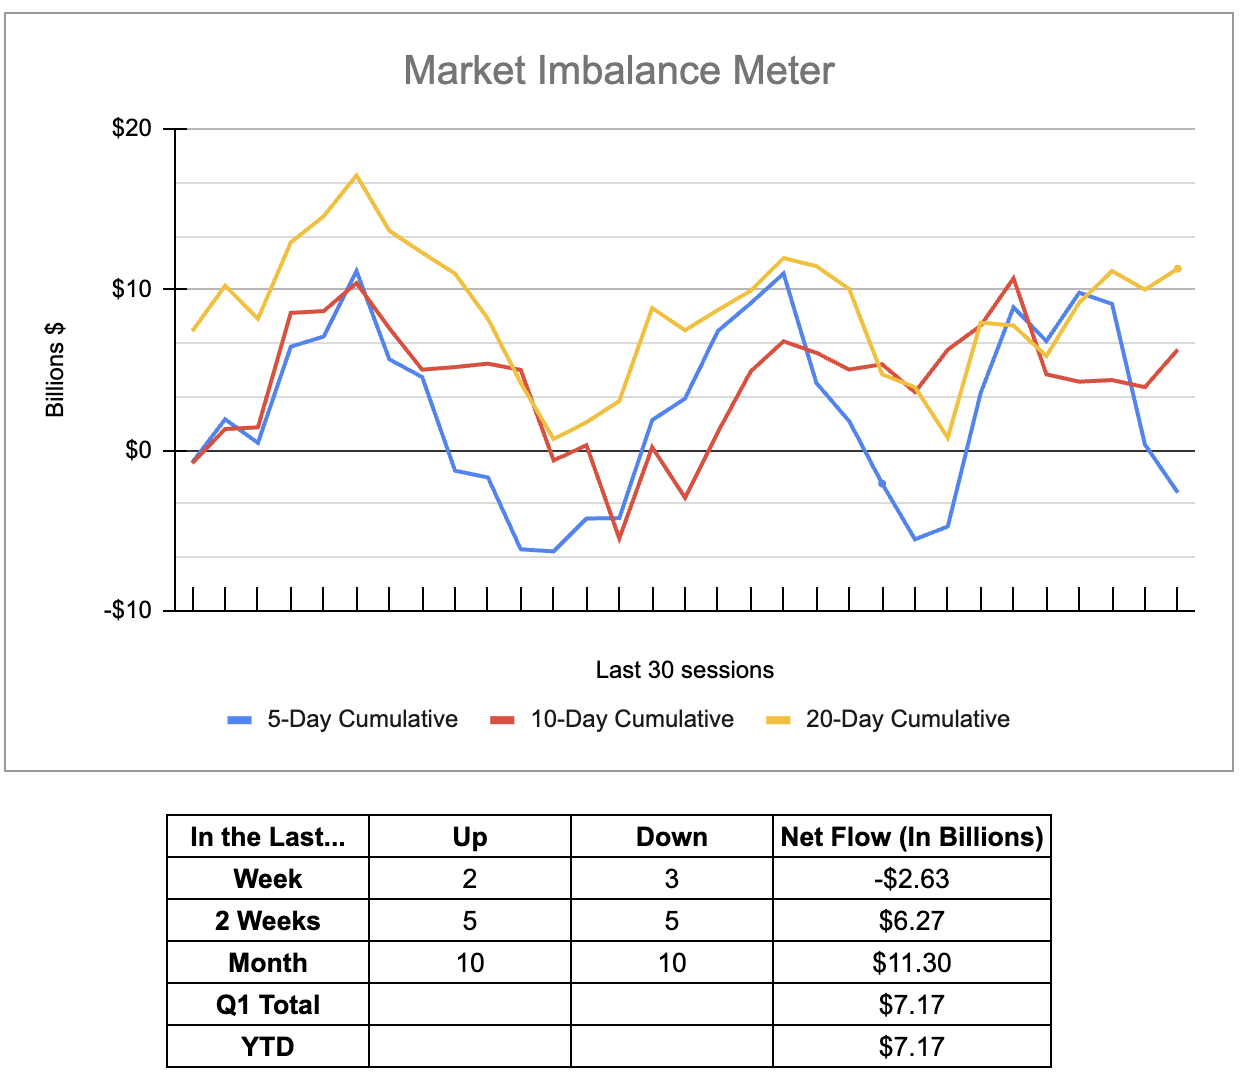
MiM and Daily Recap
ES Recap
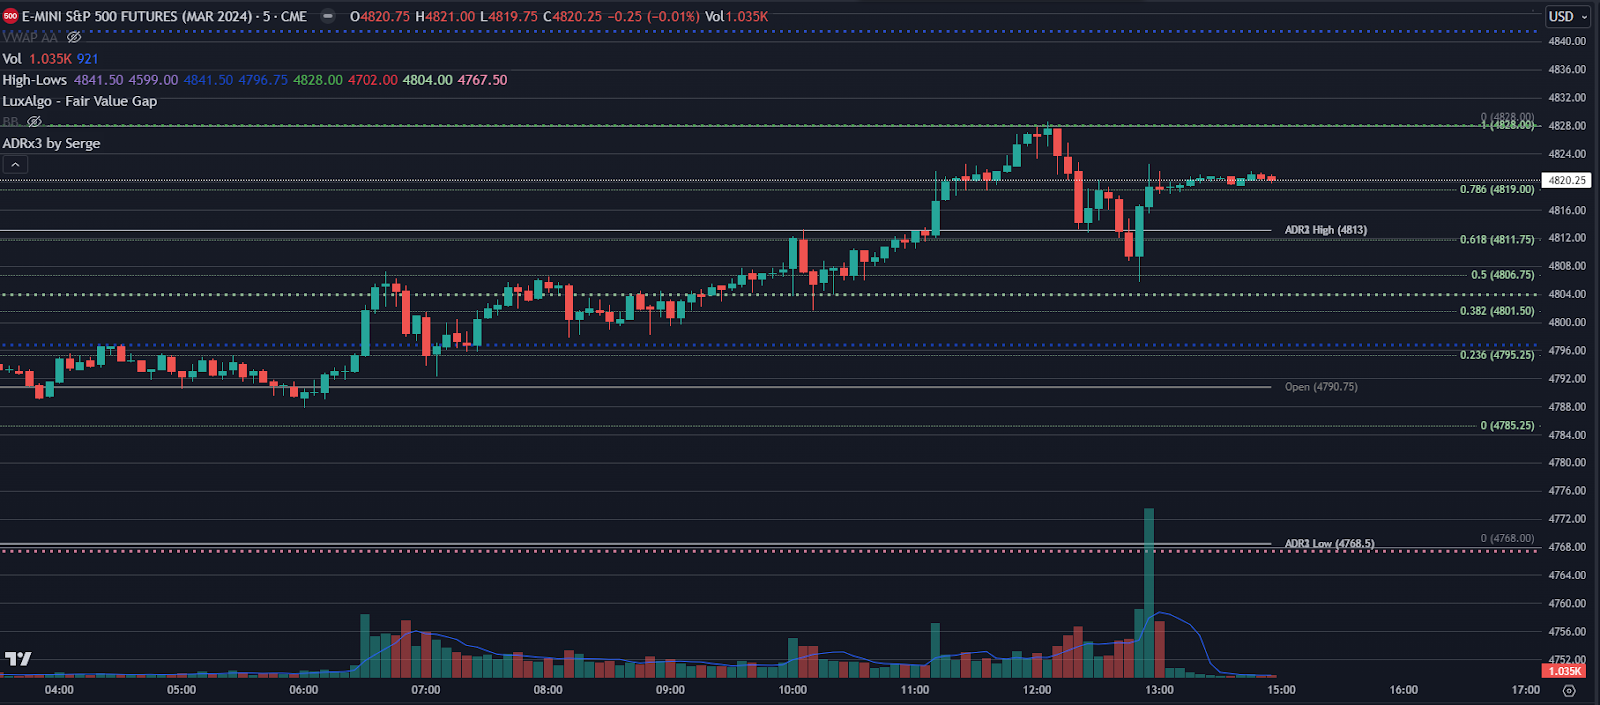
The ES traded up to 4804.00 and sold off down to 4786.00 and opened Wednesday’s regular session at 4795.25. After the open, ES traded 4795.00, rallied up to 4807.25 at 9:45, and I pointed out to the MrTopStep chat:
-
IMPRO : Dboy : (9:47:53 AM) : Unlike the last 4 days you can see the NQ was not going bid
-
IMPRO : Dboy : (9:48:14 AM) : it rallied but no firepower
From there, the ES sold off down to 4792.25 as the NQ sold off 90 points. After the low, the NQ selling dried up and started to short-cover, pushing the ES backup to a new high at 4806.50 at 11:11. Then the NQ started to sell off, dragging the ES back down to the VWAP at 4797.75 at 11:14, and slowly back-and-filled its way up to a new daily high at 4813.25.
After the high, the ES sold off down to 4801.75 at 1:13, traded up to 4828.50 at 3:05, then sold off down to 4809.25 and traded 4809.50 as the 3:50 cash imbalance showed $590 million to sell. The ES traded down to 4805.75, rallied up to 4822.50 and traded 4819.25 on the 4:00 cash close. After 4:00, the ES remained in a narrow range and settled at 4820.25, up 29.75 points or +0.62% on the day.
In the end I think I said it correctly in the MrTopStep chat: IMPRO : Dboy : (10:41:25 AM): here is how I see it, the ES has been in an up trend since it made its Oct 27 4121 low…, 140 point pull back was good for the index markets.
In terms of the ES’s overall tone, it was firm but not as firm as the NQ. In terms of the ES’s overall trade, volume was slightly higher: 176k contracts traded on Globex and 1.129 million traded on the day session for a total of 1.305 million contracts traded.
Technical Edge
-
NYSE Breadth: 46% Upside Volume
-
Nasdaq Breadth: 46% Upside Volume
-
Advance/Decline: 56% Advance
-
VIX: ~12.75
ES
Levels from HandelStats.com
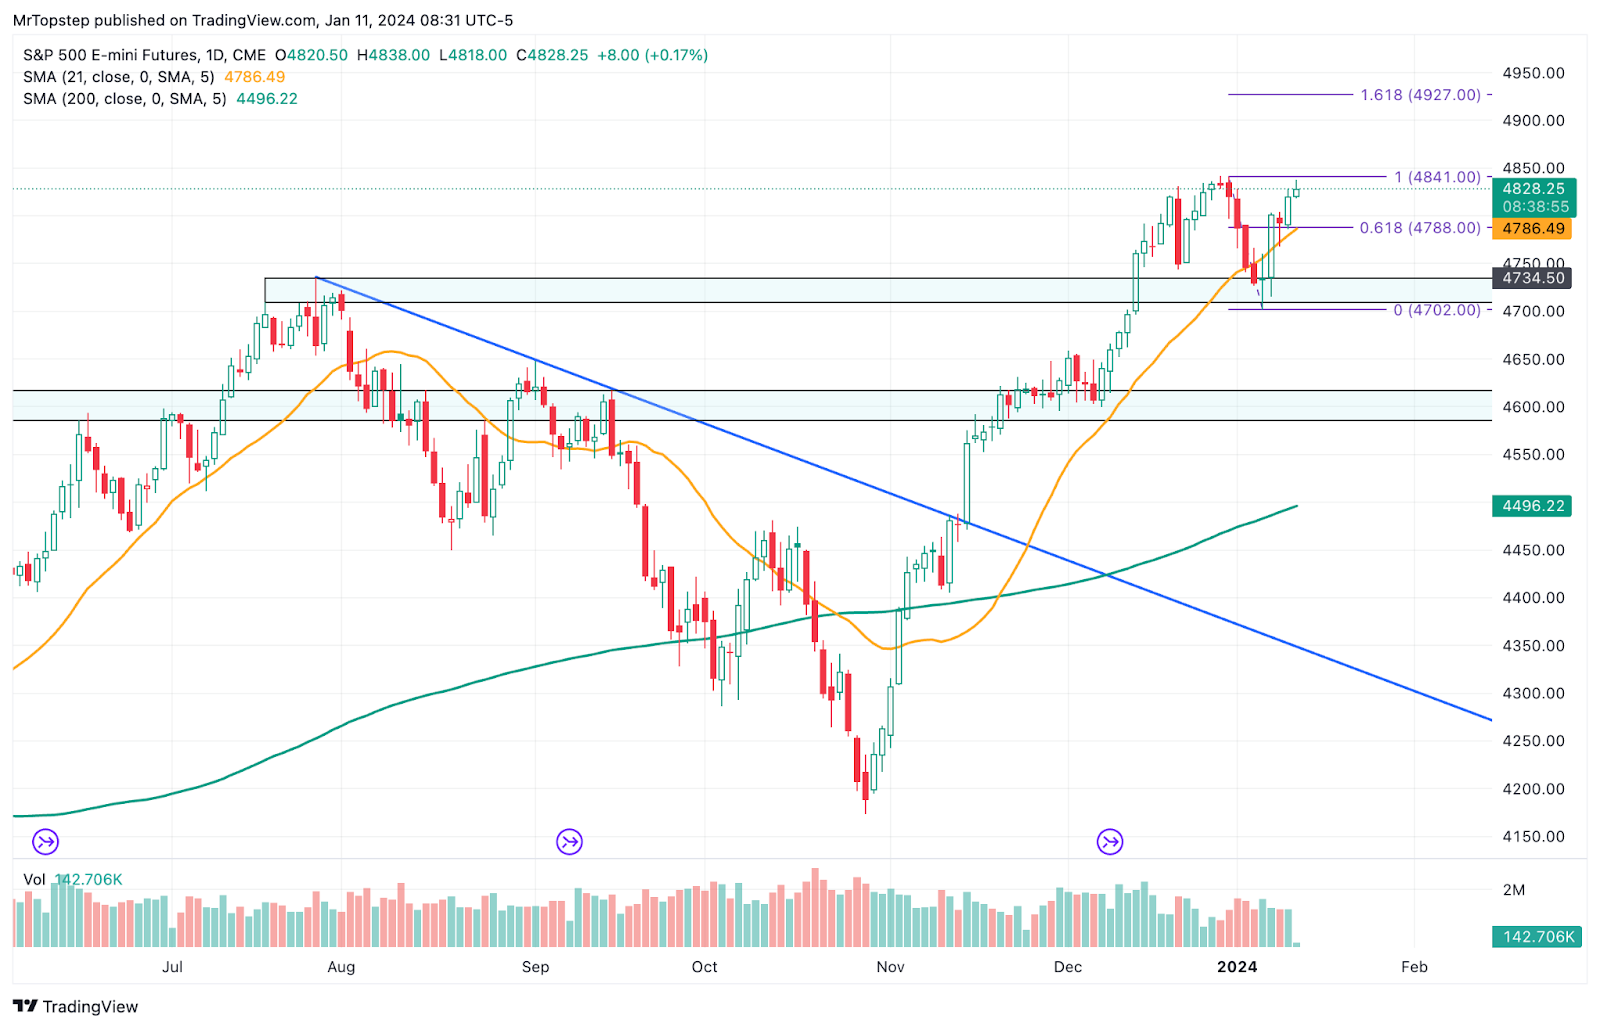
ES Daily
-
Upside: Trade and hourly close above 4826 targets 4830.25, then 4835.25, then 4838.75, hourly close above there targets 1sd at 4846.52. Hourly close above there targets 2sd weekly at 4864.96, then 4870.80, then 2sd at 4873.53. Hourly close above there targets 4900.55.
-
Downside: Trade below 4826 targets settlement at 4819.50. Hourly close below there targets 4808.75, then 1sd weekly at 4800.98. Hourly close below there targets 4793, -1sd at 4792.48. Hourly close below there targets 4789, then 4784.50, hourly close below there targets 4769.62, then -2sd at 4765.47. Hourly close below there targets 4757.88, then 4749.50, then -3 sd at 4738.45.
NQ
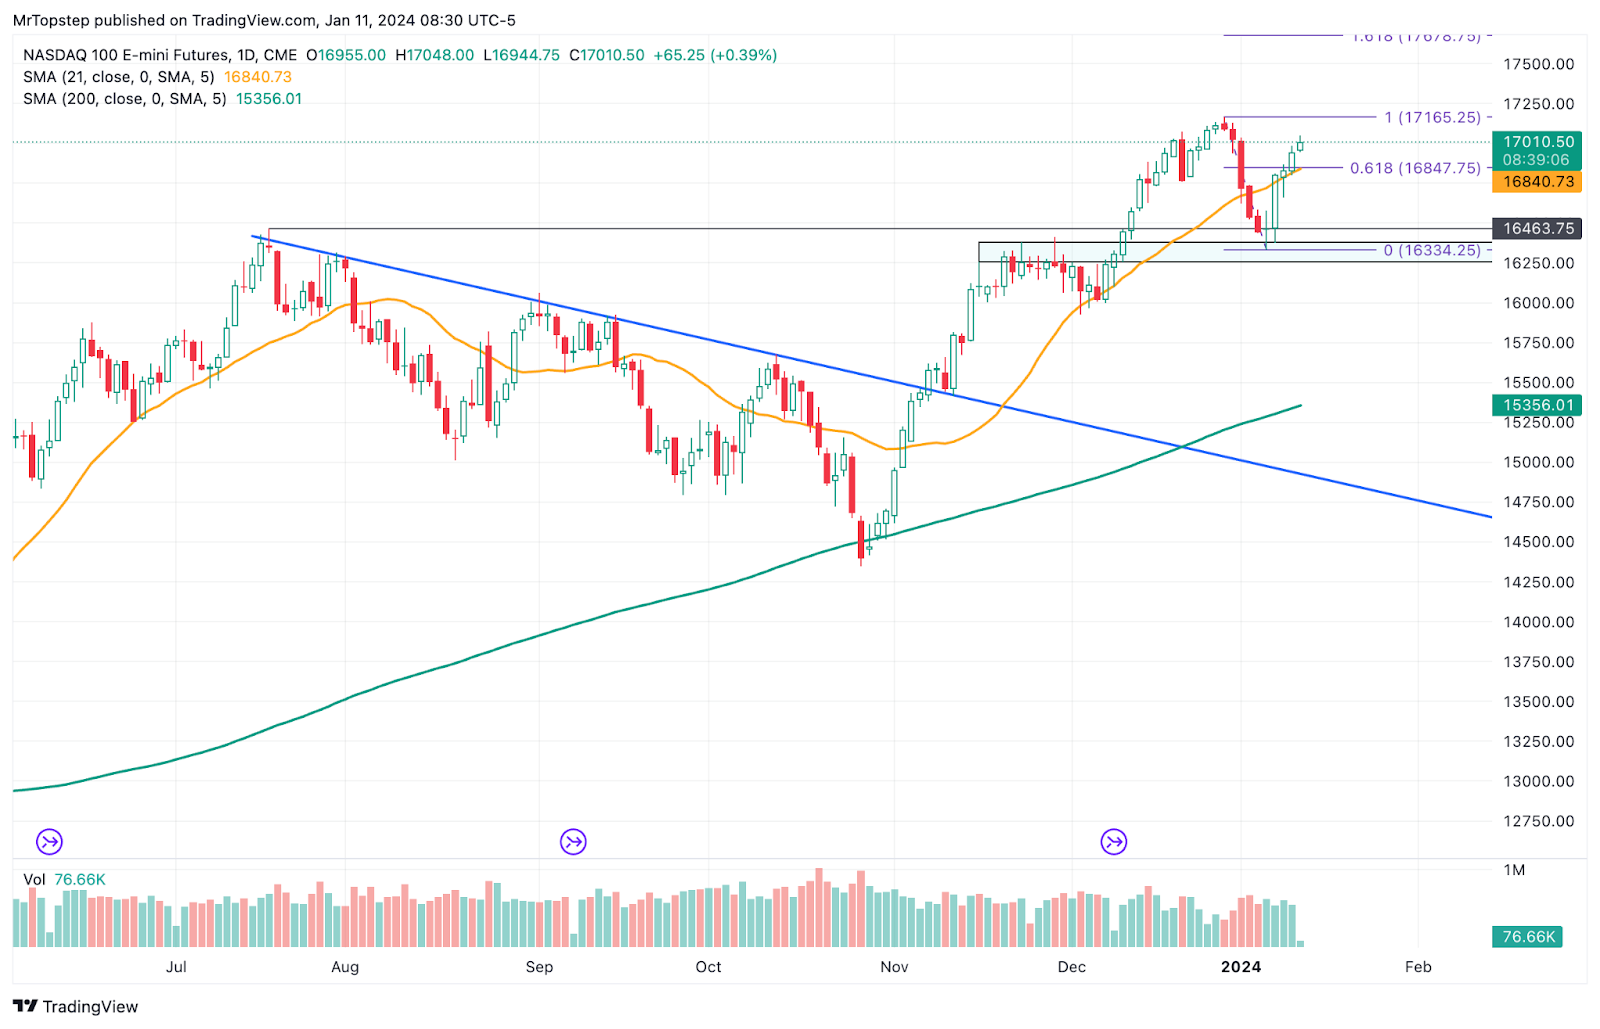
NQ daily
-
Upside: Trade and hourly close above settlement at 16950.25 targets 16997.75, then 17003.50 then 17008. Hourly close above there targets 17030.50, then 1sd at 17090.16. Hourly close above 17093 targets 2sd weekly at 17107.90, then 17117.12. Hourly close above there targets 17153.75. Hourly close above there targets 2sd at 17230.08.
-
Downside: Trade below the settlement 16950.25 targets 16915.75, 16912.75. Hourly close below there targets 16841.25 hourly close below there targets -1sd at 16810.34. Hourly close below there targets 16804.75 then 1sd weekly at 16787.57, hourly close below there targets 16723.25, hourly close below there targets -2sd at 16670.42. Hourly close below there targets 16614.88. Hourly close below there targets -3sd at 16530.51.
Economic Calendar
Comments are closed