Our View
I keep saying the selloff is not over but got caught with my pants down last Friday. Unlike other market-trading newsletters, I admit when I’m wrong and I had Friday wrong.
It’s been a seller’s market and the truth is, the markets are not done on the downside. I still see ES 3800 as my downside objective and I think by July the S&P will be on its way. Why will the markets tumble?
- Inflation and consumer prices are rising at the fastest pace in 40 years
- The Fed’s plan to step up the pace and size of its interest rate hikes
- Mortgage rates are at the highest level since 2011 and are a threat to the housing market
- Soaring energy prices
- Supply chain problems
- And the ever-destabilizing war in Ukraine
The PitBull isn’t too optimistic, either.
He told me Friday that while some of the big names have recovered, many of the ‘hot stocks’ are still down 60% to 70%. He has been bearish since last November and continues to warn about further downside.
You have heard me say that things are “disjointed” and there is something bad coming. I’m usually very carefree, but the overwhelming level of bad news is reason to be concerned.
Our Lean
During bear markets, the S&P rallies early in the day and early in the week. When I told the PitBull that I thought the S&P would go to 3,800, he didn’t seem phased. The bond rout is going to continue and if that’s the case, the ES is going lower. They have been too correlated for it not to matter.
If the S&P does bounce, don’t be fooled: It’s just another dead cat bounce.
Our Lean: My guess is we bounce and then initially short cover after the 9:30 open. I still think we see lower prices, but not until they run some of the shorts out. 4420 to 4440 should be a good resistance area if we get there.
Daily Recap
The ES traded 4444 on Thursday’s regular session open, rallied up to 4455.75 at 9:41, and sold off down to 4414 at 10:00. That pop to the early high was it for the bulls, as the ES made a series of lower highs for the rest of the session.
It rallied 17.5 points to 4431 and was rejected, declining to 4403 shortly after 12:30. From there it popped 24 points to 4427 and was again rejected. The ES traded 4396.50 as the 3:50 cash imbalance showed over $2 billion for sale as the ES closed near the session low at 4387.50. At 5:00, it settled at 4389, down about 55 points or 1.23% on the day.
In terms of the ES’s overall tone, it went from firm to weak in a matter of minutes. In terms of the ES’s overall trade, volume was steady at 1.396 million contracts traded.
- Total Range: 64.50 points
- H: 4455.75
- L: 4385
Technical Edge
- NYSE Breadth: 69% Downside Volume
- NASDAQ Breadth: 67% Downside Volume
After a big-breadth rally on Wednesday, the bulls totally dropped the ball on Opex Thursday, as we took a bearish turn into the holiday weekend.
Earnings will really pick up the pace this week and in general, earnings season could play a big role in what happens next. Do they buy stocks on the news or sell them and cause the next leg down? Powell speaks this week too, for what it’s worth.
Game Plan
Those of you who have been reading the Game Plan for several months know that I like to tip-toe into Mondays. Monday sets our trading tone for the week and I hate starting off on the wrong foot.
As nice as some of our individual trades have been, the indices remain a tough trade.
S&P 500 — ES
- Feel free to extrapolate this chart to SPY

The ES moved lower in Globex but is popping off the lows. Last week, the prior week’s low (at 4444.50) was resistance all week.
Now flirting with last week’s low during Globex (at 4375.50), bulls need to recover this mark.
If they can do so and stay above it, it puts 4400 in play, then the 4412 to 4417.50 zone. Above that puts active resistance in play via the declining 10-day moving average.
On the downside, watch the Globex low at 4355.50. A break of that mark that’s not reversed could open up 4321 on the downside.
Nasdaq — NQ
- Feel free to extrapolate this chart to QQQ
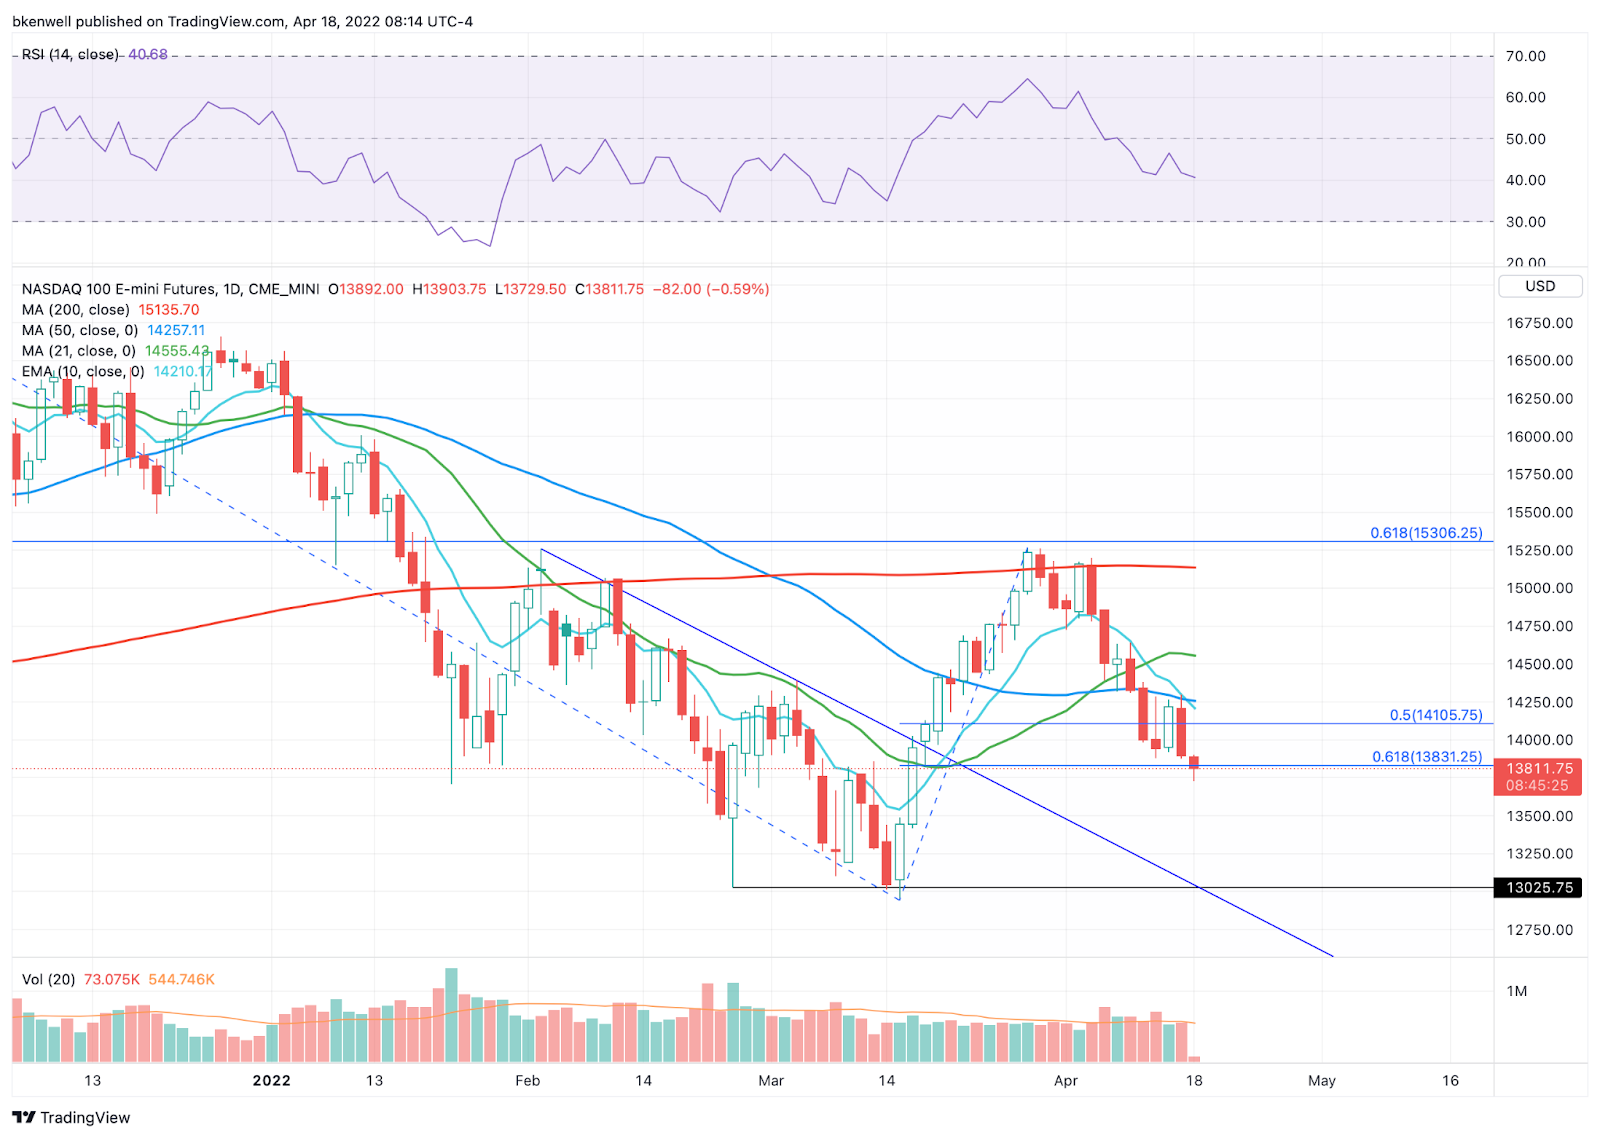
Bonds have had a big influence on the NQ lately, so keep that in mind.
On the upside, if the NQ reclaims last week’s low of 13,876 and pushes above the Globex high (13,904), then we could see a push back to 14,000. About 14K puts 14,100 in play and potentially the declining 10-day.
On the downside, failure to reclaim last week’s low and the 13,830 level leaves the NQ in a vulnerable position.
VRTX

Still looking for a dip. Last week’s low and the 10-day stick out to me.
COP

Inside week here, with potential for a weekly-up rotation over $102.40. $105 to $107 would be a quick upside target to take off ⅓ or so.
PXD — tight weekly chart as well and I’m watching $257.65 (last week’s high). Anyone long from April 6th can still aim for $273 to $275.
EOG — Inside week as well.
Go-To Watchlist
*Feel free to build your own trades off these relative strength leaders*
Numbered are the ones I’m watching most closely. Please look at these closely, as there are several updates (the most recent of which are noted in bold).
- PANW — Trimmed into weekly-up area near $631. Still looking for $645 to $655 on the upside against a B/E stop (near $598)
- MKC — Exiting on too slow of development → Those who are long can look to trim at $105, then $107 while stop is now at break-even or ~$99.
- TGT — Monthly-up over $229.50 → first target ($237 hit). So B/E stop and looking for $250 on the upside.
- HD — Nice pop so far, but no targets hit. Conservative bulls can use a B/E stop now. I am still looking for $320 to $325 on the upside.
- WMT — Trim at $158 → B/E Stop. Inside week. Now looking for inside-and-up rotation over $158.29. If so, it puts $162 in play for small trim, otherwise $165 to $170 is our longer term target.
- ABC — $164 trim spot hit → B/E stop ($160) in effect. $166 is the next ideal trim spot. $170 to $172 would be for the final tranche.
- COST
- DLTR
- MCK
- BRK.B
- XLB — ADM, MOS, NTR, CTVA, NEM
- ABBV
- TU
- VRTX
- BMY
- Energy — FLNG, XLE, APA, CNQ, CVX, ENB, PXD — etc.
- PANW
- AR
- AMGN
- ABC
- UNH
- VRTX
Economic Calendar

As we all know, there’s no crystal ball when it comes to trading stocks, options, or futures. But the Market Imbalance Meter may be as close as it comes. Knowing how the “Big Money” is placing its bets can give our trading room a big wave to ride — or a warning sign to stay out of the water. Come check it out now, risk-free for 30 days.
Comments are closed