Our View
It has not been an easy month. After The S&P dropped hard in March, it rallied 500 points and then reversed, now down 5 of the last 6 sessions. The news is not getting better and with two 50 bps rate hikes on the table for May and June, it’s looking like it’s going to be a long, hot summer.
I did good trading in the first hour yesterday, lost most of it when I came back from lunch, then caught a big winner and ended up having a nice day. You can beat the bots a few times, but they will ultimately get you and that was what they did to me yesterday. I went back to the well too many times.
I know most traders like to hang over their screens all day, but I think all the rips, dips and flashing quotes will eventually catch you offside. Maybe you can control your risk better in options, but when it takes most of the day for the futures to drop 30 or 40 points and they reverse 35 points in 30 minutes, it doesn’t matter what you are trading.
Our Lean
Just trade it…sell the early rallies and buy the pullbacks with an eye on the bonds. If the ES and NQ short cover and the bonds start making new lows, “sell it.”
Remember, the S&P rallies early in the day and early in the week during a bear market. Bonds made a new low last night at 139.13 and continue to struggle. Eventually, they’ll snap higher, but not yet.
The trading levels for the ES are outlined below.
Lastly, I do not know what this means,but the YEN started the year at 8700 and is trading 7800, a 50-year low. The EURO was trading 124.50 and it’s trading 108. What’s the word I’m looking for again? Oh yeah…Disjointed.
Daily Recap
The ES opened Monday’s regular sessions at 4376 and then traded up to 4403.75 at 9:40. After some sideways to down price action, the ES broke down to 4379 at 11:00 and then sold off all the way down to 4364.50 at 12:41. After the low, the ES ground its way back up to the 4406 level at 1:58, sold off down to 4391.25 at 2:19, and then rallied back up to 4406.25 at 2:25.
The ES traded 4367 as the 3:50 cash imbalance showed $1.25 billion to sell, traded 4365, and then traded up to 4385.50. It traded 4388 on the 4:00 cash close and settled at 4399.50 on the 5:00 futures close, up 12 points or 0.27% on the day.
In the end, it was all about the late-day weakness. In terms of the ES’s overall tone, it went from good to bad pretty quickly. In terms of the ES’s overall trade, volume was LOW at 1.12 million contracts traded. Despite April’s positive Dow stats the Nasdaq is down 6.3%, the worst April since 2002. The S&P’s 3.1% loss is the worst loss since 2012.
- Total Range: 50.75 points
- H: 4406
- L: 4355.50
Technical Edge
- NYSE Breadth: 43% Upside Volume
- NASDAQ Breadth: 37% Upside Volume
I’m a bull at heart, but the headwinds have me in a cautious state. The hawkish Fed — with Bullard saying yesterday that 3.5% rates by year-end would be the “minimum needed.” The market is currently pricing in 2.5% by year-end. Supply chains were improving, but the lockdown situation in China is exacerbating the problem. Inflation may have peaked, but high prices continue to weigh on consumer spending.
While that may set us up for a deeper decline, it doesn’t mean there won’t be bounces along the way.
Game Plan
Bonds remain an issue, IMO. They have had a high correlation with the Nasdaq/tech stocks. As bonds slump, it acts as an anchor to the Nasdaq. As the Nasdaq slumps, it weighs on the S&P.
At a minimum, I would suggest having the TLT and/or the ZB contract up on your screen.
S&P 500 — ES
- Feel free to extrapolate this chart to SPY

In the short term, keep an eye on yesterday’s high.
Monday’s action gave bulls a doji candle to work with. If we can clear the high — 4406 — it will put the ES over the 50-day moving average as well. That puts active resistance via the 10-day in play, followed by the 4440 level.
Bigger picture, above the 10-day and 50-day, could open the door up to 4490 to 4500.
On the downside, keep last week’s low — 4375 — on your radar. Below that level keeps pressure on the ES and leaves Monday’s low vulnerable at 4355. Below 4355 could put 4320 to 4325 in play.
Nasdaq — NQ
- Feel free to extrapolate this chart to QQQ

The NQ is in a very similar situation, albeit a bit weaker. A daily-doji-up rotation over 14,002 opens the door for a possible push up to the declining 10-day. Like the S&P 500, this measure has been active resistance.
On the downside, watch 13,830. Not only is it the Globex low, but it’s the 61.8% retracement of the current range. Below it puts this week’s low in play at 13,730.
Remember, bonds have been steering the ship lately.
Bonds
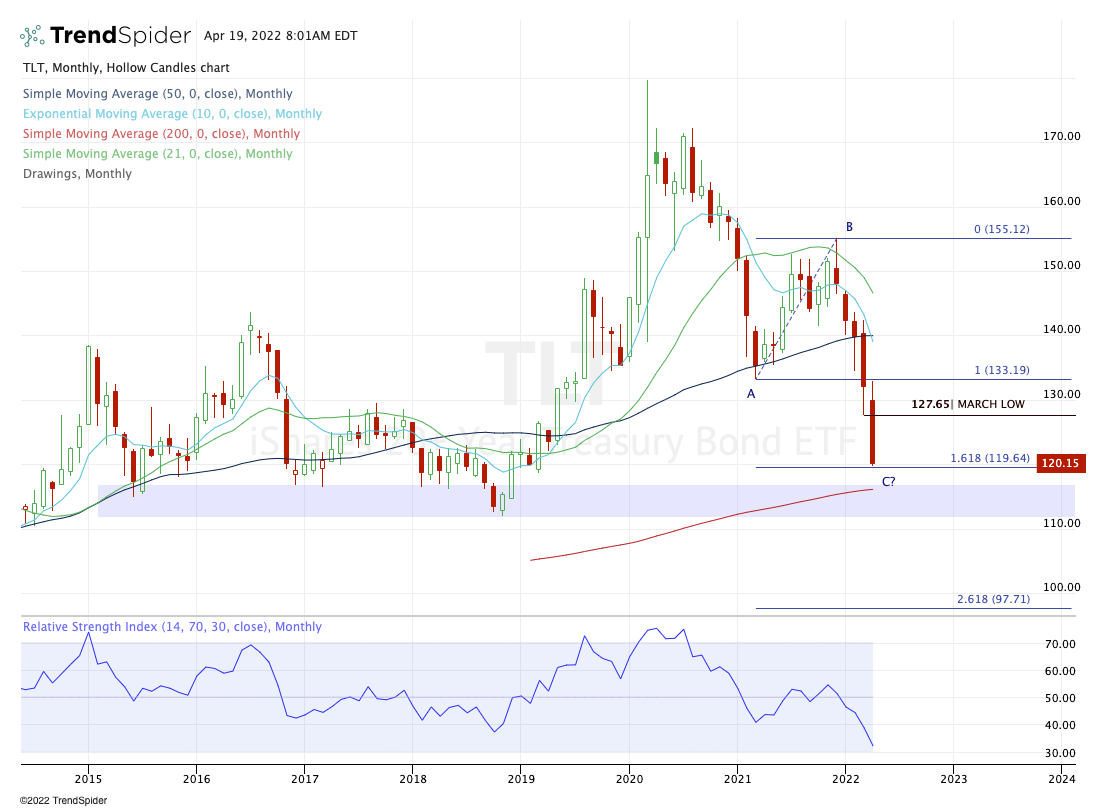
We have an ABC correction playing out in the TLT. For now, we’re getting into the 161.8% downside extension. For me personally, I am leaning toward waiting for a test of the 200-month moving average and this long-term support area between $112 and $117.
That said, I’m trying not to be too picky given the five-month, 23% decline. That’s a painful ride in bonds.
Go-To Watchlist
*Feel free to build your own trades off these relative strength leaders*
Numbered are the ones I’m watching most closely. Please look at these closely, as there are several updates (the most recent of which are noted in bold).
- COP — Triggered weekly-up at $102.50. → $107 is ideal first trim zone, but conservative bulls can do so closer to $105 if they prefer.
- PANW — Trimmed into weekly-up area near $631. Still looking for $645 to $655 on the upside against a B/E stop (near $598)
- TGT — Monthly-up over $229.50 → first target ($237 hit). So B/E stop and looking for $250 on the upside.
- HD — Nice pop so far, but no targets hit. Conservative bulls can use a B/E stop now. I am still looking for $320 to $325 on the upside.
- WMT — Trim at $158 → B/E Stop. Inside week. Now looking for inside-and-up rotation over $158.29. If so, it puts $162 in play for small trim, otherwise $165 to $170 is our longer term target.
- ABC — $164 trim spot hit → B/E stop ($160) in effect. $166 is the next ideal trim spot. $170 to $172 would be for the final tranche.
- COST
- DLTR
- MCK
- BRK.B
- XLB — ADM, MOS, NTR, CTVA, NEM
- ABBV
- TU
- VRTX
- BMY
- Energy — FLNG, XLE, APA, CNQ, CVX, ENB, PXD — etc.
- PANW
- AR
- AMGN
- ABC
- UNH
- VRTX
Economic Calendar

As we all know, there’s no crystal ball when it comes to trading stocks, options, or futures. But the Market Imbalance Meter may be as close as it comes. Knowing how the “Big Money” is placing its bets can give our trading room a big wave to ride — or a warning sign to stay out of the water. Come check it out now, risk-free for 30 days.
Comments are closed