Our View
This is going to be short. The PitBull has said many times that he can’t believe I have written the Opening Print for so long. To tell you the truth, after almost 27 years of writing it, nor can I. It’s a labor of love but I am going to take a few days off.
In that respect, I also want to say thank you to our subscribers. Whether you’ve been with us for years and years or just a couple of weeks, it’s appreciated. Without you, this “labor of love” wouldn’t be worth writing. So thank you all for that.
As I’ve said many times before, if you have big profits, don’t hold off from taking off half or just get out completely. While I still think higher prices are on the way, there is no reason to look a gift horse in the mouth.
The ES basically traded 4800 and fell apart as the late-day rebalancing hit.
The PitBull said yesterday that the big investment firms bought stocks and sold bonds yesterday and he thought they could do the opposite today.
Our Lean — Six 2022 Predictions
I sold out of my longs. Many think the ES is going south, but I still think we could see higher prices as we head into the new year.
That said, the ES dropped out of bed last night. It sold off from 4775 down to 4750 in 15 minutes and then popped up to 4770. I am generally up for the fight, but I am totally beat from all the rips and dips of December and looking forward to starting fresh in 2022.
Below are my DBOY predictions for 2022.
- S&P will correct at least 15%, but close near the highs of the year
- Bitcoin will rally to $80,000 or higher
- Gold will continue to underperform
- Crude oil will trade $120
- China and the US will clash over Taiwan
- Covid will have less of an impact on world economies
Daily Recap
The ES opened at 4789.75, made an early low at 4786.25, and rallied up to 4799.75, one tick shy of ES 4800.
After the high, the ES gradually pulled back down to a higher low at 4787.75 and then chopped around in a 5-point range. From there, the ES traded back down to 4787.25 at 2:15 and back up to the 4793 area at 2:52. Just after 3:00, the futures got hit by a sell program that pushed the ES down to a new low at 4785.25 as the MIM started showing $95 million to sell and then dropped down to 4775.50 at 3:49.
The ES traded 4774 as the 3:50 cash imbalance showed $827 million for sale, traded down to 4767.25 at 3:58, and traded 4772.25 on the 4:00 cash close. The S&P ended the day at 4772.50 at the 5:00 futures close, down 11.5 points or 0.24% on the day.
In the End
In the end, it was a slow day on a list of many recently. The higher the ES rallied, the more the volume fell. In terms of the ES’s overall tone, it was firm until the late-day sell programs hit. In terms of the ES’s overall trade, volume was low, at just 713,000 — the lowest tally this week.
As we all know, there’s no crystal ball when it comes to trading stocks, options, or futures. But the Market Imbalance Meter may be as close as it comes. Knowing how the “Big Money” is placing its bets can give our trading room a big wave to ride — or a warning sign to stay out of the water. Come check it out now, risk-free for 30 days.
Technical Breakdown
- NYSE Breadth: 62.6% upside volume
- NASDAQ Breadth: 73.2% upside volume
When I started contributing to this newsletter, my No. 1 rule was simple: Write exactly what my personal Game Plan is for the day. Do not force any trades for the sake of publishing them in the newsletter.
That was it.
Forcing trades is where we get ourselves into trouble. Over the years, I have learned that it’s just as important to know the optimal trading periods as it is to know the suboptimal trading periods.
The only thing worse than missing a Grade-A setup is to nail a winner and then cough up the gains after taking some low-grade setups.
In that respect, December was not easy but it was very profitable for us to separate the ideal trading zones from the poor ones. We sat our hands when we needed to and struck when the time was right.
I also want to say thank you — thank you for being a subscriber! Without you here, there would be no one to write to and it’s a serious passion of ours. So thank you very much, have a Happy New Year, and cheers to 2022.
Game Plan
For most of this week, we have toned down the quantity, but that has resulted in a big increase in the quality of our setups.
In other words, the market (and many stocks) were too high to buy and too strong to short. It’s the last day of the year and volume should again be low. Let’s see if we get any opportunities in the market.
Otherwise, let’s enjoy the New Year, recharge and have more good fortune in 2022.
S&P 500 — SPY
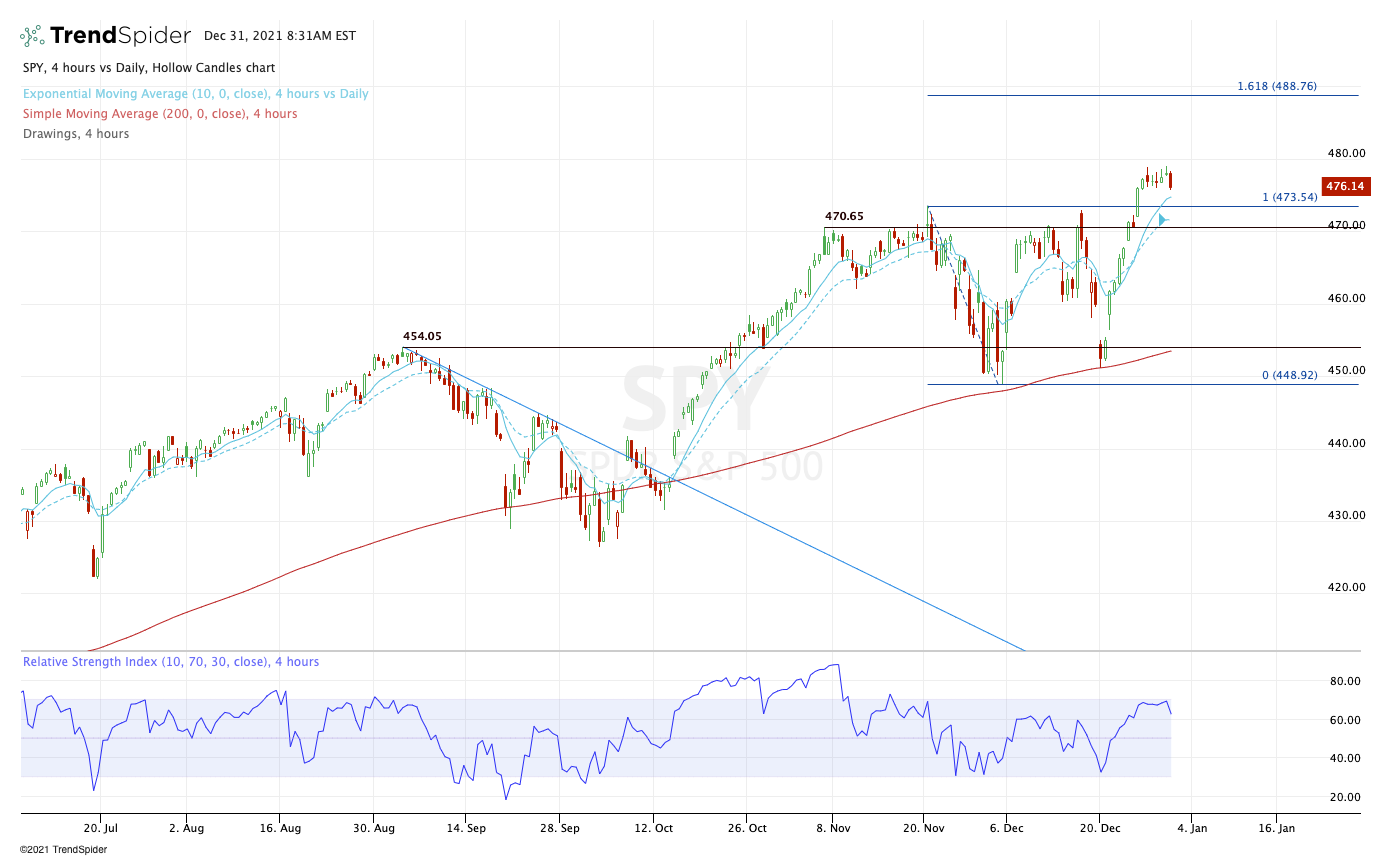
Above is a four-hour chart of the SPY.
Let’s see if we get a retest of the 10-ema on the 4H chart along with the double-top/breakout area of $473.50. If this is a bounce zone, it should give us a nice cash-flow trade today.
If we need a little more air to come out of the SPY, the larger breakout zone near $470.50 could be on the table, along with the 10-day moving average (overlaid on the chart above, with a multi-timeframe analysis setting).
I would be a nibbler in both scenarios.
Individual Stocks — ARKK, Gold
We have a lot of leading, trending stocks that are starting to rest and reset. That’s great! But we’re not to the point where these stocks are in our buy zone yet.
Two names I want to look at are ARKK and Gold.
ARKK
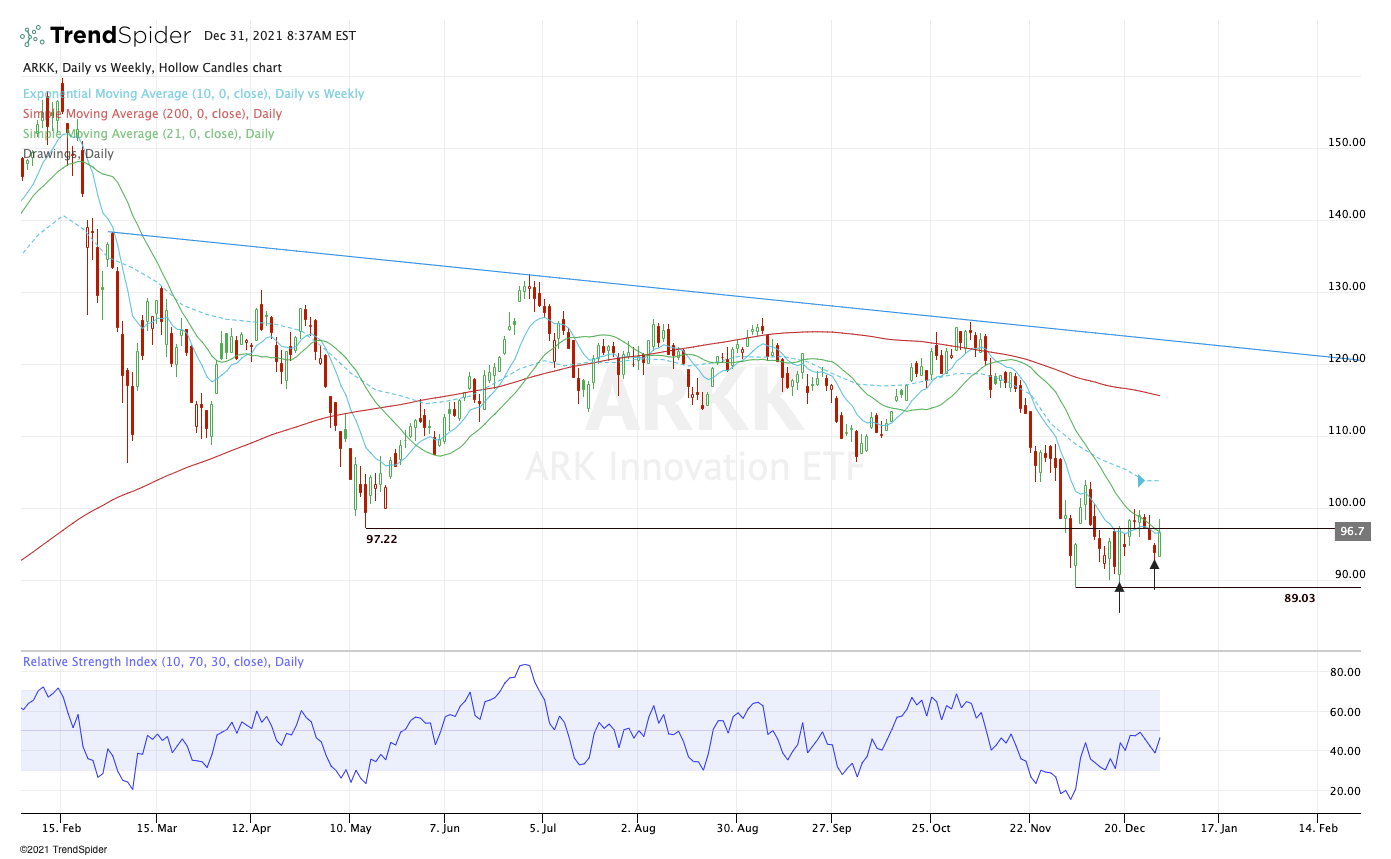
ARK traded pretty well yesterday — up 3% vs. a 0.28% loss in the SPY — and continues to put in a series of higher lows.
Maybe it’s all BS going into year-end, but perhaps it’s not. Tax-loss selling is out of the way and the group has been beaten down. It keeps ramming into the $97.50 to $100 zone and the short-term moving averages.
The more times an area is tested, the more likely it is to break. If we can get a pop over these levels, we could see a nice move higher. On the downside, I’m cautious below $97.50 and very cautious on a break of this week’s low.
Gold
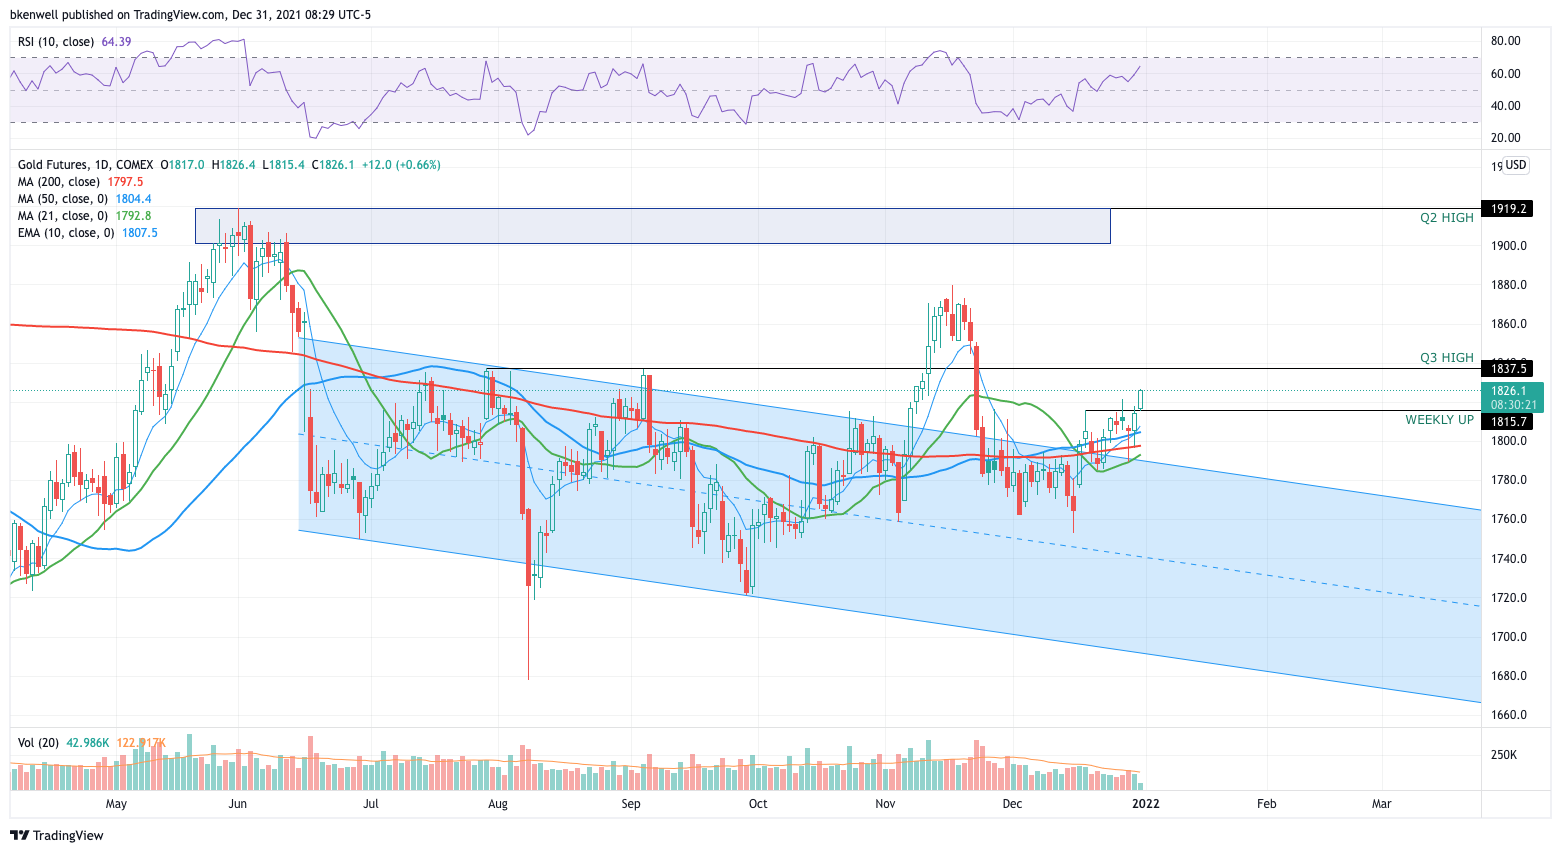
I’m using the futures for this chart, but gold is trading pretty well today, going weekly up over ~$1816. It’s gold’s fourth straight weekly gain.
Keep an eye on this. For now, the Q3 high is in focus at $1837.50, but as soon as we flip the calendar, the Q4 high will be in focus near $1880.
The gold trade sort of fell apart from November, but we caught a huge chunk of that move and it was quite profitable for us. Can it happen again?
*Don’t forget, there are micro gold contracts, as well as the GLD for non-futures traders.
Disclaimer: Charts and analyses are for discussion and education purposes only. I am not a financial advisor, do not give financial advice and am not recommending the buying or selling of any security.
Remember: Not all setups will trigger. Not all setups will be profitable. Not all setups should be taken. These are simply the setups that I have put together for years on my own and what I watch as part of my own “game plan” coming into each day. Good luck!
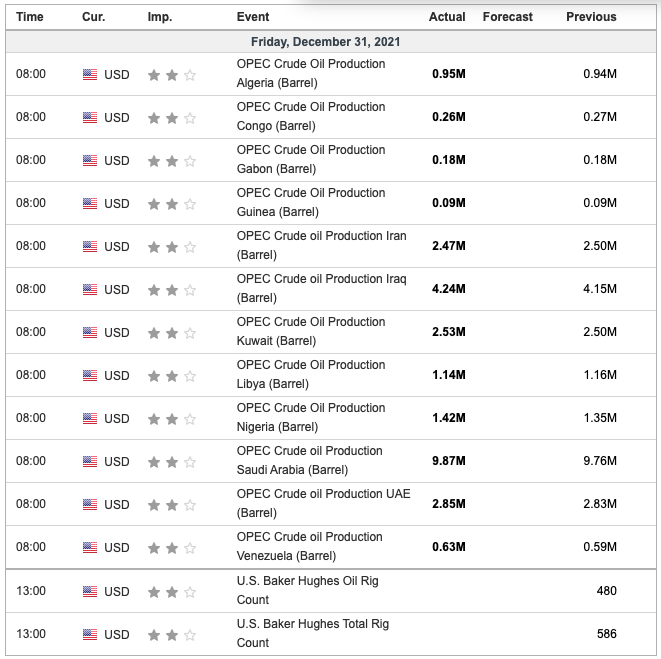
Economic Outlook
Comments are closed