There are a lot of events this week, but this is likely the biggest.
Our View
It’s a busy stretch: We have the CPI report today, the PPI report tomorrow, the Quad-Witch expiration on Friday, and the Fed next week.
Obviously, some of these overlap and are correlated with each other, but by and large, only one thing matters today and that’s the CPI report.
As I said last week it’s one thing after another, and good or bad, it’s ended up as a positive for the S&P futures, which have rallied 255 points in the last 4 sessions. One would think there would be a let-up, but like the last two sessions, the pullbacks have gotten smaller and the upticks have gotten larger.
The question is, is the rally about the expectation of lower inflation, or a combination of all of the above? And if the CPI number comes in better, will they sell the news? With the S&P up over 6% and the NQ up 8% over the last 5 sessions (including today’s Globex high), today’s number is going to be a big deal for sure.
Our Lean
Over the last few sessions, the ES has had a few 20- and 30-handle pullbacks, but I think today will see an end to that as I expect some wild swings. Like it or not, the bulls own the tape right now and this could go on right into the end of the quarter.
The funny thing about yesterday’s rally was the VIX closed higher (up almost 5%). My guess is some traders were adding some options hedges on.
Our Lean is simple: Be Careful!
I know everyone wants me to make a big call ahead of the CPI print, but I’m not in the prediction business like that. A wrong call like that could easily get someone crushed; it’s like playing earnings on the S&P with index futures. Win big or lose big, but it’s a coin toss either way.
I expect an uptick in volatility today and even if the market rips, traders need to exercise caution. Capital preservation is our first pillar of focus when it comes to trading and when the volatility ranges expand, we can get run over if we’re on the wrong side of the move.
My guess is we see some big two-way moves today.
Daily Recap

The ES traded up to 4115 and opened Monday’s regular session at 4107.75. The ES rallied 34 points to the session high of 4137.75, fell 19 points down to 4120, then popped 14 points up to 4132.50. It was a morning full of nice pops and drops.
After the rally, the ES fell 28 points to the session low of 4105.25 shortly after 12:00, rallied 26.5 points back to the low-4130s, then fell into a narrowing range into the afternoon. The ES traded 4118.50 at 3:30, then went on a buying spree and push higher into the close despite the MIM coming in at $630 million for sale.
The ES traded 4130.50 at the 4:00 close, but pushed the regular session higher after 4:00 and settled at 4137 at the 5:00 futures close. It ended higher by 44.50 points or 1.1%.
In the end, the bulls won again, with ES up 4 days in a row for a total of 255 points. In terms of the ESs overall tone, it was bought on every 20 to 30-point pullback. In terms of the ES’s overall trade, a total of 2 million ESZ traded, but 30% of it is the ESZ/ESU spread volume.
- Daily Range: 57.50
- High: 4137.75
- Low: 4080.25
Technical Edge
- NYSE Breadth: 86% Upside Volume (!)
- NASDAQ Breadth: 72% Upside Volume
- VIX: ~$23.75
Game Plan: Bonds, Dollar S&P, Nasdaq
All I will say is, the CPI report is going to drive the markets today. There’s no other way to put it.
Friday’s 90%+ upside breadth day was followed by an 86% upside day on Monday and came after an 80%+ upside day on Wednesday. That’s a pretty impressive thrust.
Mapping out levels ahead of a huge event is hard, but this is what I have circled on my charts.
Bonds

I just can’t help but notice the bonds. Yesterday, bonds reversed their early gains and actually made new weekly and year-to-date lows. While the S&P screams higher, no one seems to be talking about the bonds, which have all but led the way this year.
Is this a case of “smart money” telling us what’s next? After all, the fall in bonds preceded the fall in stocks earlier this month and the bottom earlier this summer. Or is this a scenario where we’re seeing at a break in correlation between bonds and stocks?
Today may go a long way in helping us answer that.
Dollar
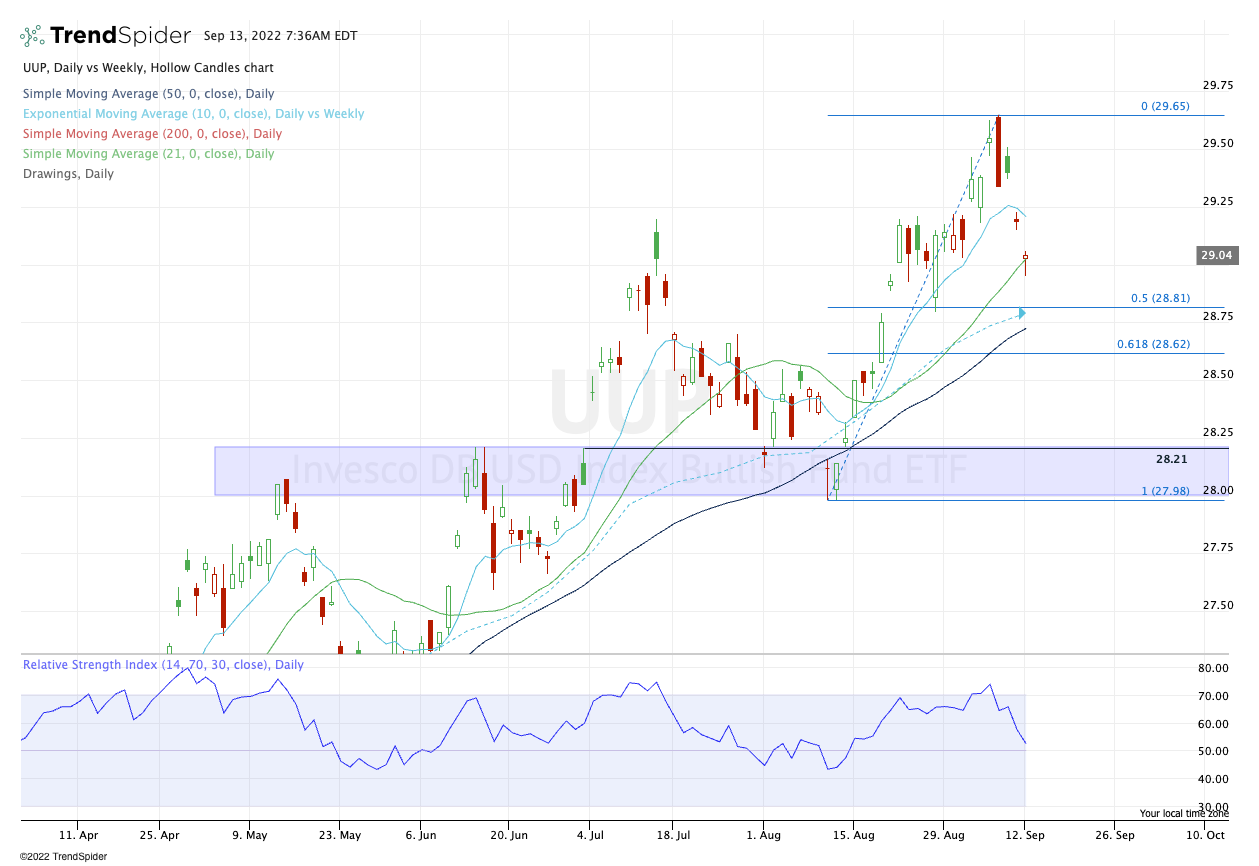
For equities to remain strong, it would be nice for the dollar to continue lower and not act as a headwind.
Set to gap lower again on Tuesday — and again the CPI report is going to be a driver here — I want to see how $28.75 to $28.82-ish area is handled. These measures have been support in the past and I want to see if they are support again.
If so, it may be another opportunity on the long side, as the USD has treated us well this summer.
S&P 500 — ES
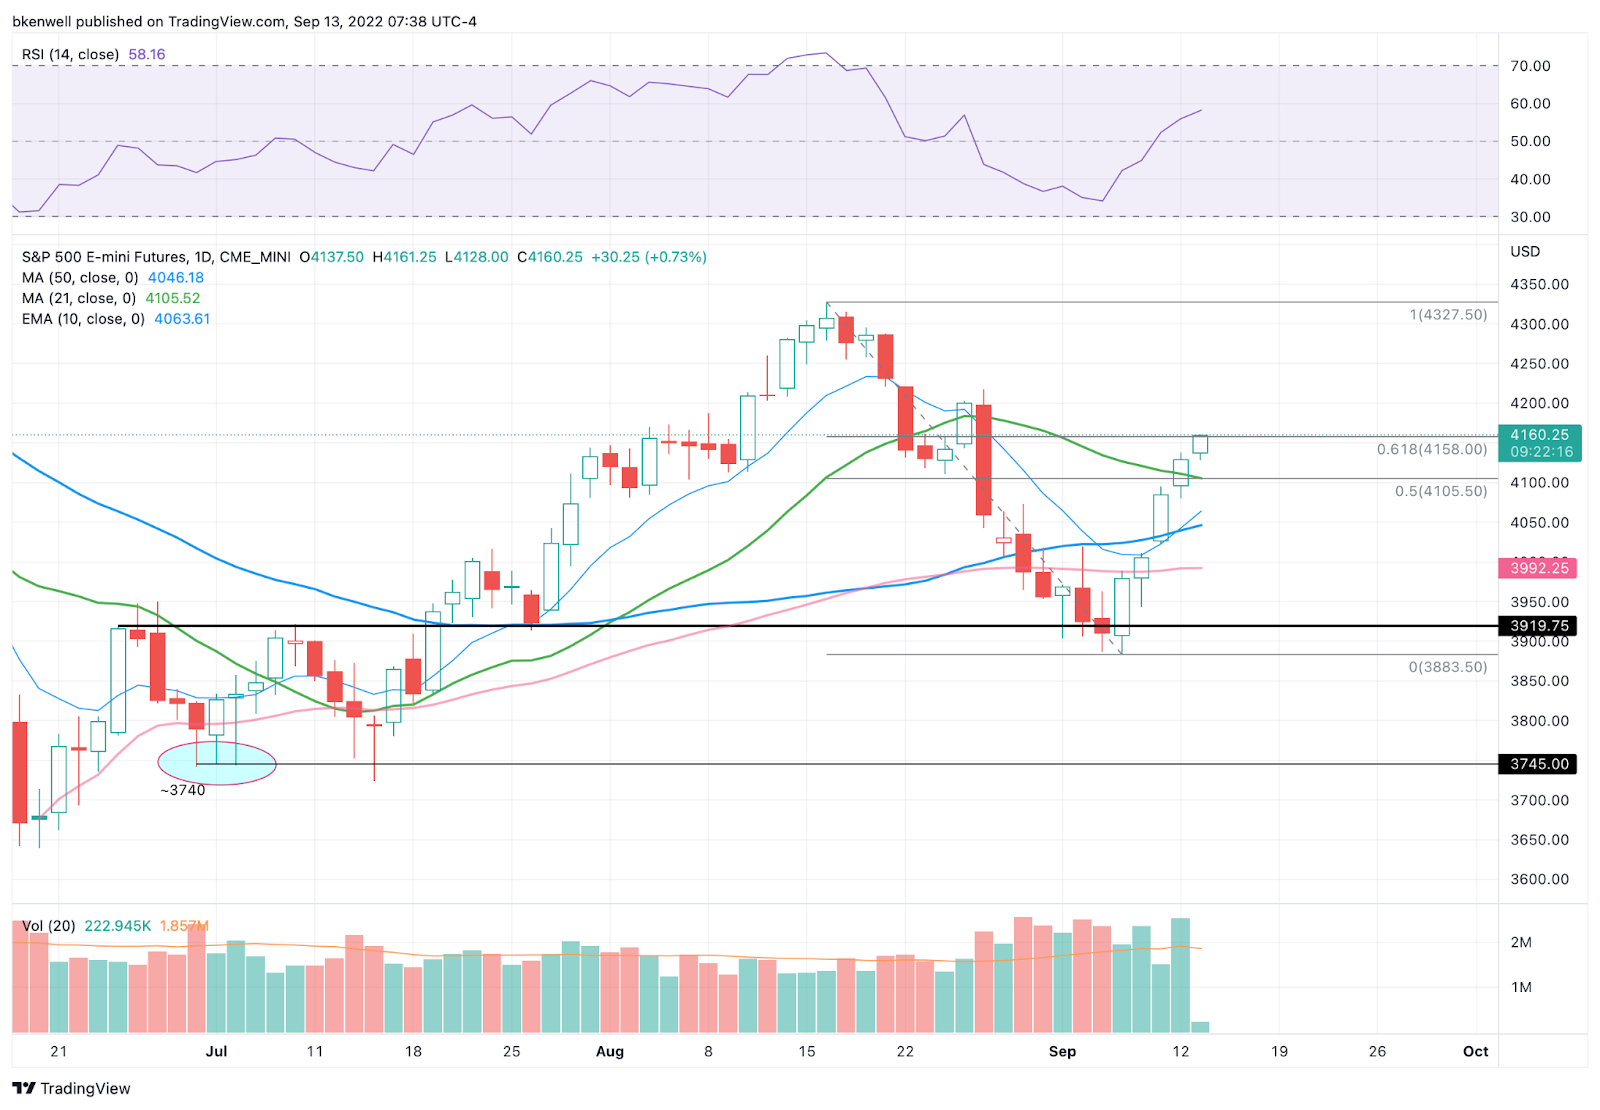
“If we take out the Globex high of 4115 and power higher, don’t rule out a move to 4150 to 4160 (the 61.8% retracement).”
We didn’t quite get that high yesterday, but we’re there now in Globex. Again, all of this is CPI-dependent, but man, you have to be impressed with the way the ES has cruised through any potential resistance on this move.
Now into the 61.8% retrace and the inflation report will dictate whether it’s resistance or simply a hurdle on its way to 4200+
On the downside, larger support looms at 4050-ish (the 10-day and 50-day moving averages).
SPY

Yesterday was into a resistance area, but with this morning’s gap-up, you wouldn’t think that’s the case.
Below Monday’s low of $408.46 and we can see a bigger move to the downside. The level that stands out as support is $400 to $402.50, while a continued push higher puts $420 in play — the breakdown level from late August.
Nasdaq — NQ

“More specifically, I am looking at the 12,830 area as a sell.”
This one was a great trade yesterday, as it gave us just a minor push above 12,830, then a 100+ point fade. It let us get ahead early in the week, which is always a huge plus.
Now things are a little trickier. On the upside, I’m watching 13,050. Above that puts 13,200-ish in play. On the downside, I’m watching 12,600, then 12,400.
Nasdaq — QQQ

Gapping into a very key area, the QQQ faces a big hurdle at $312.65.
Above opens the door to the $317.50 to $320 zone. If it’s resistance, $300 could be back on play on a larger fade. I am trying to look at the bigger zones ahead of a big event.
Go-To Watchlist — Individual Stocks
*Feel free to build your own trades off these relative strength leaders*
- Numbered are the ones I’m watching most closely.
- Bold are the trades with recent updates.
- Italics show means the trade is closed.
LNG — I still want to see ~$150!
Watching NVDA near resistance, from Monday’s setup.
- UUP — Down to ¼ position as we hold for potentially higher prices. Raise stops to $28.40 to $28.50. Look for $30 on the last piece.
- TMUS — We’re down to a ½ to ⅔ position after a great response. B/E Stops and if at ⅔, can trim on any move above $148. Ideally looking for $149.75 to $150+ next.
- Conservative bulls can inch up their stop-loss to $142-ish, but I like a B/E stop for now.
- CHRW — Got our first target of $114.50+ | I still like a stop of $111 to $111.40 and $116 as our next target to get down to a ½ position
- CHNG — Consider taking the last piece off at $25.75 to $26 or simply hold against a B/E or better stop and ride the trend higher. #Kudos
- OXY — Opening push on Buffett upping his stake, investors can trim as we will be near B/E on the position or they can ride against a $63.50 to $63.75 stop-loss. Three strong lows to measure against last week between $64 and $64.40.
Relative strength leaders →
Man, Solar came to life yesterday didn’t it? Not surprising as these names litter our top 5.
Top:
- TAN
- ENPH
- FSLR
- LNG — Looking for a retest of the $150 area!
- CAH
- F
- XLU
- XLE
- OXY
- BMRN
- PWR
- CHNG
- CELH
- COST
- UNH
Economic Calendar

Comments are closed