Quad witch is still on deck for Friday.
Our View
Did yesterday’s sell-off surprise me? No! The reason? Because this is how the game is played. You fall in love with the ES up 230 points, then you end up with pie in your face because the S&P is in a bear market and it keeps reminding us.
Remember our 6 Bear Market Rules? Those help keep you grounded.
Bonds made new contract lows at 131.02, the euro got killed (in anticipation of a stronger dollar) and sold off from 101.90 down to 99.64, and gold was down $25/oz. I know this may sound alarming, but I think this is all a build-up to something very big.
Our Lean
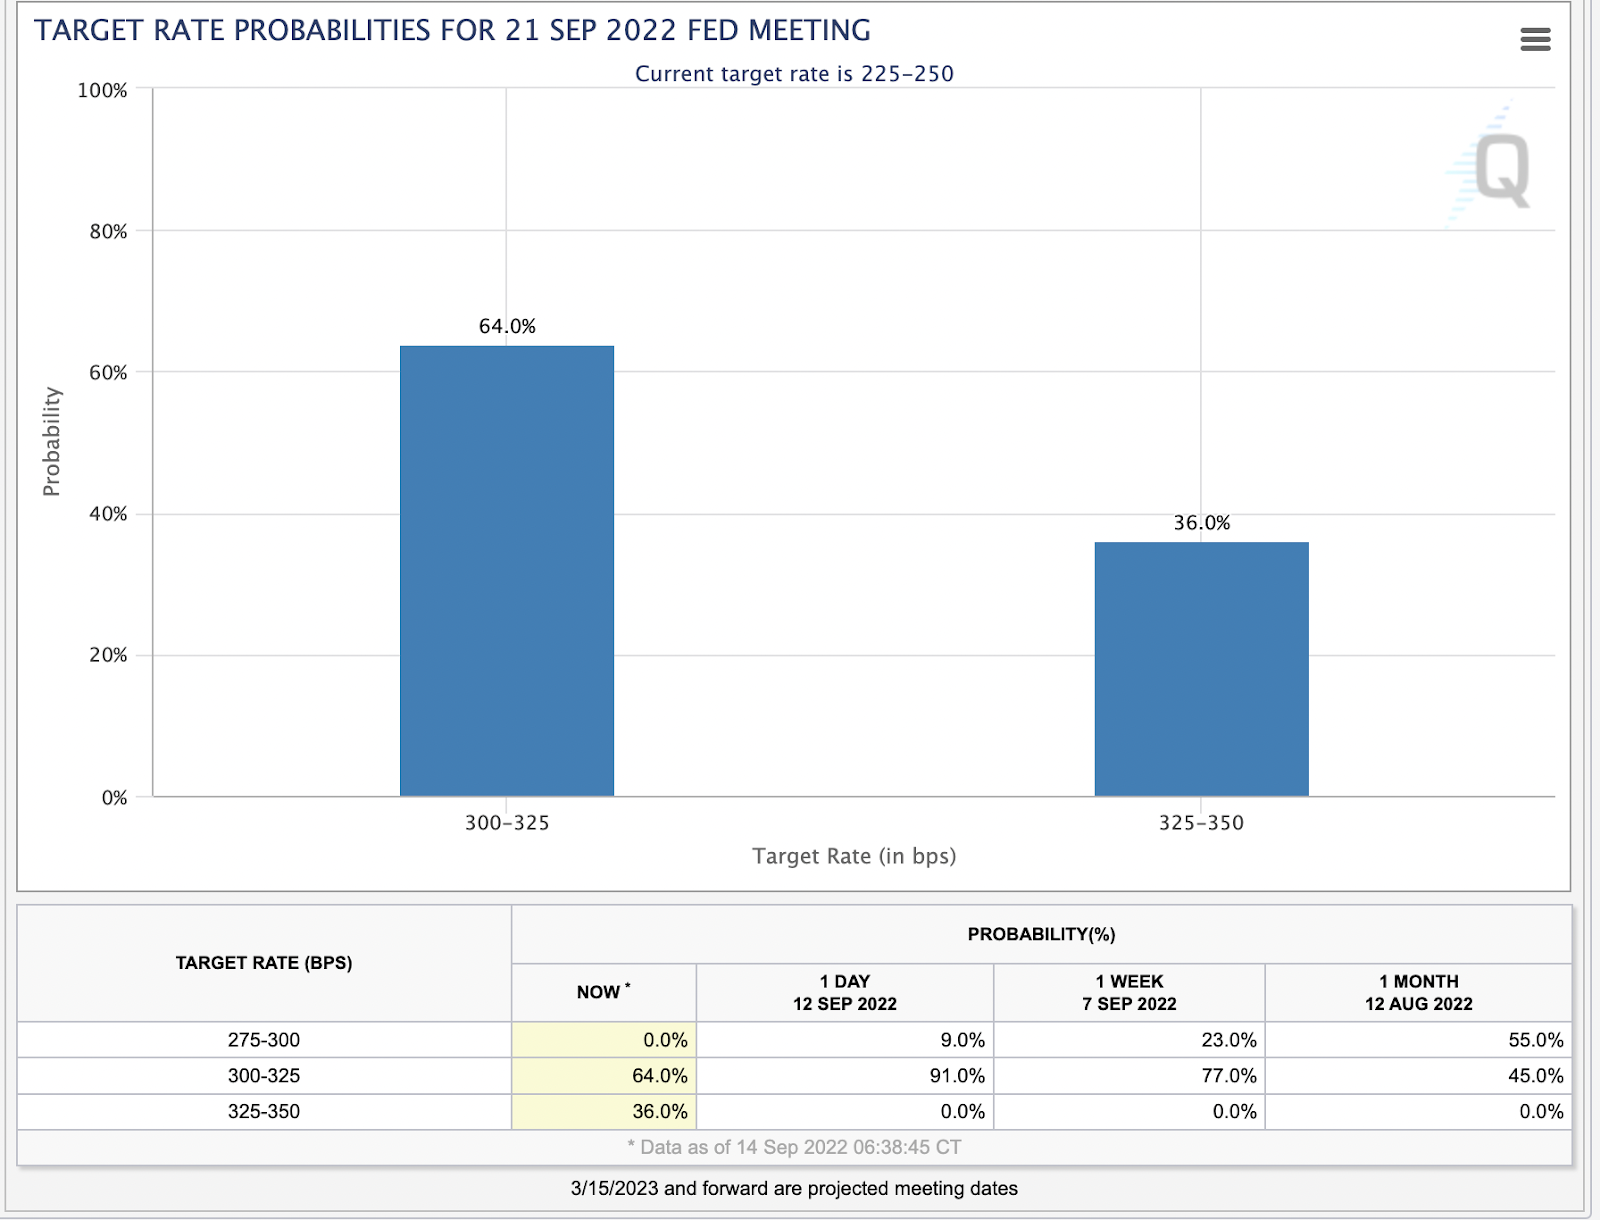
A week ago, the odds for a 50 basis point hike from the Fed on Sept. 21 was 23%, and a 77% chance for a 75 bps hike. Now those odds call for a 64% chance of a 75 bps hike and a 36% chance of a 100 bps hike!
Yesterday, we urged caution ahead of the print — saying that the market hinged on the CPI report — then issued an update to keep selling the rallies. With that CPI report coming in too hot, the Fed has to hold its ground on its hawkish rhetoric and even become more hawkish.
After yesterday’s CPI report, now we get the PPI report — another risk to account for. The Globex bounce has been weak sauce as well. With yesterday’s inflation print and the ensuing action, I am seeing warning lights flashing…higher rates, energy scarcity in Europe, the railroad strike (seriously right now?!)…the list is building up again.
Our Lean: I can’t rule out a bounce, but I think it will be for sale. You can try to buy the early weakness and sell the rallies or just be patient and sell the rallies (the latter option is likely best). There was a low made at 3922.50 on Sept 7. Below that is 3911 and congestion of support at the 3896 level down to the old low at 3883.75, start breaking down through there 3875, 3850.
Daily Recap

It was funny at 8:30:01, as I saw the inflation numbers populate on the screen in green. Inflation expectations were higher than expected.
That’s bad, I thought.
Then I saw the ES pop higher by a dozen points. Confused, my eyes darted back to my other screen wondering if I misread them. Nope, they were bad and by the time I looked back at the ES — 5 seconds later — we were down 50 handles. A minute later and we were down 120 handles.
Here’s a 5-second chart, just to be sure.
In the end, it didn’t matter. By the time the ES opened at 9:30, it was 140 points off the high. It rallied 15 points, was sold immediately, and dropped 50 to 55 points down to 4000 support. This is when it actually got tricky. The selling dried up, but buyers couldn’t get a rebound going.
The ES ended up bouncing about 20 handles into the 1:30 high, then completely fell apart by falling 78 points down to the 3938.50 low. The MIM showed $1.2 billion for sale and the ES was able to ride into the close at 3951.25 on the 4:00 cash close, up about a dozen points off the low.
The ES settled at 3955.25 on the 5:00 futures close, down 174.75 points or -4.23% on the day. The Nasdaq futures closed down 696.50 points or -5.43%. The Dow, S&P, and Nasdaq all had their worst one-day loss since June 11, 2020. All 11 S&P sectors and all 30 Dow components closed lower.
In the end, the wheels on the bus came to a screeching halt, and it was another great example of another ‘dead cat’ bounce. In terms of the ES’s overall tone, it saw a crash. In terms of the ES’s overall trade, total ES volume (including the spreads ahead of the quad-witch expo) was high at 3.158 million contracts traded.
- Daily Range: 236.50
- High: 4175
- Low: 3938.50
Technical Edge
- NYSE Breadth: 95% Downside Volume (!!)
- NASDAQ Breadth: 80% Downside Volume
- VIX: ~$27
Game Plan: Bonds, Dollar S&P, Nasdaq
I think the bonds did it again; they warned investors about what was to come. In early August, we asked, “What Are the Bonds Trying to Tell Us?”
The bonds have been right all along and they were breaking to new YTD lows ahead of the CPI print.
I don’t know what yesterday’s reaction would have been had the CPI report showed a cooldown in inflation. I guess the markets would have rallied, even though they were up big in just a four-day stretch.
With yesterday’s fall, the S&P has nearly wiped out all of its gains from that big thrust, doing so on 95% downside volume. But the crazy part is, after yesterday’s action we are just back to where we were trading last Monday/Tuesday.
Let’s talk the S&P here, with a video to follow later today/tonight.
S&P 500 — ES

Watching yesterday’s low of 3938.50. A break of that opens the door down to the last two weeks of lows near 3883 to 3886. Weekly-down opens the door down to 3750 to 3780.
On the upside, the 50% retrace of yesterday’s move is ~4060, but I’m not confident we’ll get there.
ES Close-Up

I believe we are in a “sell the rallies” market. If we do rebound today, the 4000 area has my attention. This was a big support area yesterday afternoon that eventually failed and ushered in more selling pressure.
Not to mention, the 10-ema on the 4-hour chart comes into play in this zone.
SPY

$400 failed. Now the $388.50 to $390 area is big. If it fails, we could be looking at a scenario that puts the SPY down into the $370s.
There’s a gap-fill at $379 and strong support in the mid-$370s.
The 50% retrace to yesterday’s range is ~$397.50, but again, not that confident we’ll get there.
Go-To Watchlist — Individual Stocks
*Feel free to build your own trades off these relative strength leaders*
- Numbered are the ones I’m watching most closely.
- Bold are the trades with recent updates.
- Italics show means the trade is closed.
Notes:
LNG — I still want to see ~$150!
If you caught NVDA short, kudos! I was not able to grab it.
- UUP — Down to ¼ position as we hold for potentially higher prices. Raise stops to $28.40 to $28.50. Look for $30 on the last piece.
- TMUS — We’re down to a ½ to ⅔ position after a great response. B/E Stops and if at ⅔, can trim on any move above $148. Ideally looking for $149.75 to $150+ next.
- Conservative bulls can inch up their stop-loss to $142-ish, but I like a B/E stop for now.
- CHRW — Got our first target of $114.50+ | I still like a stop of $111 to $111.40 and $116 as our next target to get down to a ½ position
- CHNG — Consider taking the last piece off at $25.75 to $26 or simply hold against a B/E or better stop and ride the trend higher. #Kudos
- OXY — Opening push on Buffett upping his stake, investors can trim as we will be near B/E on the position or they can ride against a $63.50 to $63.75 stop-loss. Three strong lows to measure against last week between $64 and $64.40.
Relative strength leaders →
SOLAR remains such an area of strength, I’m really surprised by.
Top:
- TAN
- ENPH
- FSLR
- LNG — Looking for a retest of the $150 area!
- CAH
- F
- XLU
- XLE
- OXY
- BMRN
- PWR
- CHNG
- CELH
- COST
- UNH
Economic Calendar

Comments are closed