Our View – The Week Ahead
It was all fun and games when the shorts had their way. But the more they sold, the more buy stops they put in. As you all know, I coined the term “no stops go untouched in the S&P futures” and that has been the case the last few days.
The other part of this is all the big year-end rotations. On Thursday it was, “buy the ES and NQ, and sell the YM.” Today may be the opposite.
Our Lean
So where are we? We are now entering Jeff Hirsch’s ‘Santa Claus Rally’ — starting Monday the 27th. I reentered my long position late Thursday when the ES pulled back to 4661.75 and I am going to try and hold it all week.
I want to point out something: if you have big profits, do not be afraid to take half off. There is no reason to let the ES rally so much and sit there and watch it reverse. It’s too damaging to do that — both financially and mentally.
Daily Recap
The S&P 500 continued its year-end march higher on Thursday as volume dropped on both Globex and the day session. The ES opened at 4696.50, dipped a point, and then rallied 20 handles up to 4716.25 at 9:39.
After the pop, the ES back-and-filled in several small-point ranges, each time inching up to new highs, hitting 4724.25 at 11:21. After every new high, there was a 4- to 7-handle pullback.
Just after noon, total volume was only 427,000 contracts. Around 2:10, some small buy imbalances pushed the ES up to a new high at 4625.50. The ES did another shallow pullback and then traded up to 4627.75 as the MIM showed $200 million to buy at 3:15. Just after 3:30, the ES sold off down to 4720.
On the 3:50 cash imbalance, the ES traded 4729 as the final MIM showed $1.9 billion to buy, then sold off down to 4715. It was the first meaningful pullback all day. After 4:00, the ES traded in a 4-handle range and settled at 4716.75 on the 5:00 futures close, up 30.75 handles or up 0.65% on the day.
In the End
The ES thrives off low-volume short-covering rallies. In terms of the ES’s overall tone, it was firm all day, even with the late downtick. In terms of the ES’s overall trade, volume was modest at 925,000 contracts traded.
As we all know, there’s no crystal ball when it comes to trading stocks, options, or futures. But the Market Imbalance Meter may be as close as it comes. Knowing how the “Big Money” is placing its bets can give our trading room a big wave to ride — or a warning sign to stay out of the water. Come check it out now, risk-free for 30 days.
Technical Breakdown
- NYSE Breadth: 74% upside volume
- NASDAQ Breadth: 73.6% upside volume
As Danny said, it was a low volume, thin-to-win type of trading day. The markets got off to a strong start and didn’t give bulls many opportunities to get long.
On Thursday the plan was to keep things light and that’s exactly what we did. I wrote, “I’ll likely look to trim some of the longs we have accumulated for this week if we get a decent opening push.”
We got a decent opening push and that rally continued throughout the day, letting us lighten up going into the weekend. That leaves us a good, fairly neutral position to start the week — a position that lets us take advantage of any opportunities that may arise, but not force anything that’s subpar.
The Game Plan
“Next week is historically a good stretch for the markets. That’s the traditional Santa Claus rally. Over the last 19 years, the SPY has been up 70% of the time for the last week of the year. Same with the QQQ.”
Many traders will prefer to take this week off. I don’t blame them and will again keep things light assuming volumes remain light.
Fair warning: I may even trim or skip a post or two this week. We have to remember to recharge. If we don’t, we run the risk of burning out and that’s never good — especially in trading.
That said, it is statistically a strong week of trading, especially if we see tax-loss selling dry up in the final days. Let’s look at the indices.
S&P 500

Above is a weekly chart of the SPY, highlighting just how damn tight this thing has been getting. It’s always good to keep the bigger picture in mind.
It continues to hold the $450 to $453 area and the 21-week moving average. At the same time though, the $470 to $471 area continues to act as resistance.
We need a push-through resistance, potentially putting that 161.8% extension in play up near $488.
If there’s ever a week to rally, it may be this week. But keep in mind, from Monday’s low to Thursday’s high, the S&P 500 rallied almost 5%. That’s a huge move in a big index in a short span of time.
If it needs a few days of rest first, let’s see that it holds the $460 to $465 area — and preferably the higher end of that range.
Nasdaq

The weekly look for the Nasdaq futures is similar to the S&P.
Support continues to hold in the 15,600 to 15,700 area, while the 16,400 to 16,450 area remains resistance.
If we can push through resistance, let’s see if the NQ can climb to the current high near 16,767. Above that puts 17,000 on the table, then the potential for the 161.8% extension up near 17,550.
Like the S&P, the Nasdaq has put together a pretty impressive run over the last few days and is set to gap-up again on Monday. That does have me a little cautious, but again, this is typically a solid, low-volume week.
Individual Stocks — AMD and F

Above is the daily look and below is the weekly chart for AMD.
If it can clear $146 to $147 (with the weekly-up trigger up at $149.02), then we may see $150-plus in a hurry.
AMD and Nvidia have been great stocks over the last few months and if it can catch some momentum and a rotation, we could be looking at a great long trade to end the year with.
Remember, you only need a few good trades a week to do quite well in the market.

Ford
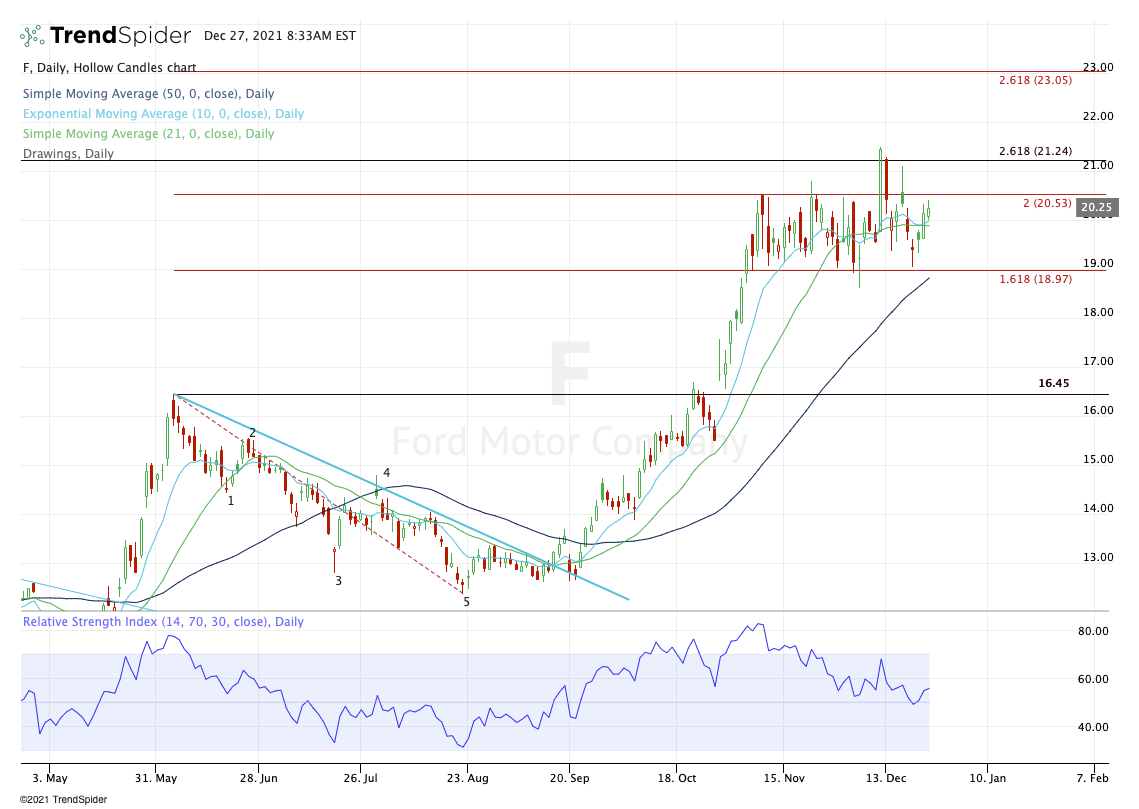
Ford is another one I want to keep an eye on.
Shares remain trapped between $19 and $20.50. A move over the latter (which is the two-times range extension) opens the door to $21.25. If it can get about this area and sustain the breakout, then we could be looking at much higher prices.
Otherwise, I’m looking to buy the dip on a pullback to $19 support and the 50-day moving average.
Economic Outlook

Comments are closed