Our View
It was a pain game for the bulls on the way down and a pain game for the shorts on the way up.
According to FactSet, the rally has not stopped traders from making short bets or hedging as short positions in the S&P futures are at the highest since June 2020. When this happens and you have natural cash buyers mixed in, it makes it a perfect environment for buy programs as it just becomes one big squeeze — hitting all the buy stops along the way.
I remember at my S&P desk when everyone was short and Moore Capital would have 1,600 big S&Ps to buy in 400-lot clips and I would have UBS in my other ear and the guy would say, “Danny, buy 400!” and I would repeat the order back to him, but the UBS trader could hear me repeat it.
He had two options. He could sell the futures and buy the S&P cash as an index arbitrage buy program or he would set the program up where he knew I had more to buy and he would still do the buy program but only sell half the S&P futures he normally would — which essentially leave him long 200 futures at $50,000 per 100 lot (or $100,000 per point). When he knew I was working my last 400 to buy, he would sell the futures out or just sell the cash.
I know computers do this automatically now, but back in the day when I was moving 6,000 to 10,000, the money was in the millions and there was a lot to be made when tailing the big dogs.
Our Lean
I screwed up yesterday. I saw everything down overnight and thought we would see my 50 to 70-point pullback, but the ES went straight up after the open. The best we got was a ~34 dip off Friday’s high.
I need to scold myself because that was a perfect down open to buy. When I was talking to the PitBull at 3:35, he said there were only 570 million shares traded on the NYSE. He talked about how ‘thin to win’ works for the upside most of the time…but it can also be dangerous if they change gears on you and you don’t adjust.
Our lean is to sell the early rallies and buy the pullbacks. I still think the ES is overdue for a larger pullback, so we are waiting for a better risk/reward setup from here and just taking trades.
Daily Recap

The ES traded opened Monday’s regular session at 4258.25 rallied 35 points off the Globex low up to 4284.25 at 9:59 and then dropped 19.25 points down to the regular-session low of 4264.75. From there, the buy programs kicked in.
The ES jumped more than 36 points up to a high of 4301.50 at 1:09. The ES dropped 10 points down to 4291.50 and then traded back up to 4201.75 at 3:00 as the early MIM showed $38 million to buy, and then traded in a small back-and-fill pattern from to 4296 level to the 4302 level. The ES traded 4302.25 as the 3:50 cash imbalance showed $2.2 billion to buy and traded 4299 on the 4:00 cash close. It settled at 4294.50 on the 5:00 futures close, up 13.75 points or +0.32% on the day.
In the end, any and all selling was used up before the day session open. In terms of the ES’s overall tone, it was another minor shakeout/pullback and then the resumption of the uptrend. In terms of the ES’s overall trade, volume was again quite low at 1.28 million contracts traded.
- Daily Range: 55.75 points
- H: 4304.75
- L: 4249
Technical Edge
- NYSE Breadth: 47% Upside Volume
- NASDAQ Breadth: 65% Upside Volume
- VIX: ~$20
Game Plan: S&P, Nasdaq, Bonds, MSFT, CF
A cautious bull state has us continually looking for upside, but man, I’ll tell ya: It would be much nicer to do so from a position of a mild dip and reset in the indices. These “runaway rallies” are not easy to maneuver on painfully low volume in the midst of what could still be a bear-market rally.
I would be trimming into this morning’s opening push on UUP.
S&P 500 — ES

Monday’s action didn’t change much.
I would still love a pullback to the 4170 area and the rising 10-day ema.
If we continue to push higher, the 61.8% retrace near 4360 is on the table, which comes into play just above the 200-day and 50-week moving averages. This area should be a trouble spot in the short term for the bulls.
S&P 500 — SPX

As for the SPX index, 4327 to 4367 is the zone to watch. That’s the 200-day, 50-week and 61.8% retrace of the total range.
On the downside, 4160 to 4170 is on watch, alongside active support via the 10-day ema. It’s been 14 sessions since we tested the 10-day — a stretch that suggests we’re long in the tooth, even if the SPX was down in 6 of those 14 sessions (wall of worry).
Nasdaq — QQQ
If the QQQ can stay above last week’s high of $330.39 and the 61.8% retrace from the June low to the March high, then $339 could be on the table.
Below $330 and we need to look for a potential test of the 10-day ema.
TLT

I hate to keep yammering on about the bonds, but yesterday the TLT was sporting a 1% gain and it rolled over and closed red!
The trend here has not been good. $114.09 is the level to watch on the downside (last week’s low). If it breaks, it’s not a good look.
CF

Daily-up over $103 puts last week’s high in play near $105.25, then a potential move up toward $110.
This is a nice rest trade at active support.
MSFT
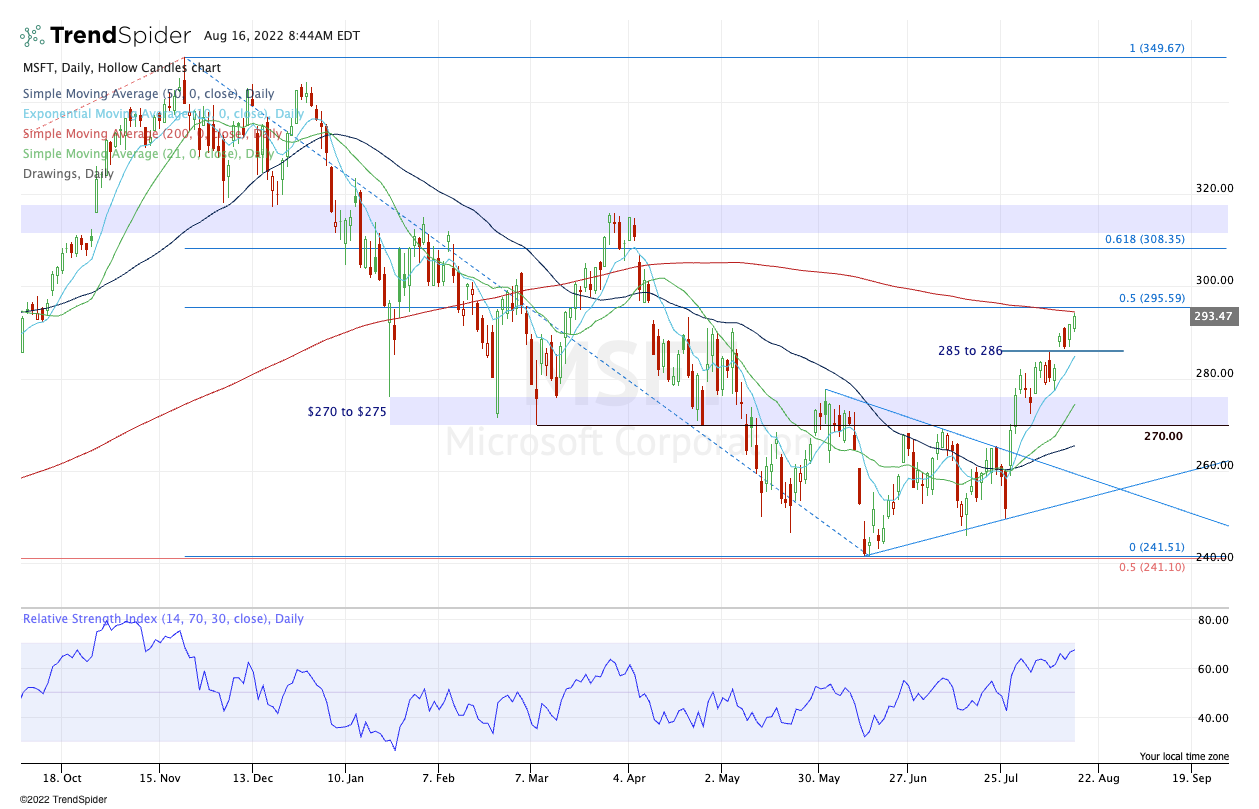
A little caution here (market-wide) as MSFT runs into the 50% retrace and the 200-day moving average. If it backs off, I want to see support near $285 to $286 and the 10-day.
A close above these measures could put $308+ in play.
Go-To Watchlist — Individual Stocks
*Feel free to build your own trades off these relative strength leaders*
- Numbered are the ones I’m watching most closely.
- Bold are the trades with recent updates.
- Italics show means the trade is closed.
Trade Sheets: Now have 2-3 live trades, all with breakeven or better stop-losses. Great stress-free position to be in as we try to squeeze a bit more of upside out of this move.
- PEP — Have trimmed PEP twice and now there’s a nice breakout underway. Bulls who want to get rid of it can let the last piece go in the $180 to $181 area. I’m more prone to see if we can get a run toward $185 instead unless the overall market unravels). B/E stop
- UUP — $28.60 to $28.80 is ideal trim zone, but bulls can trim ¼ at $28.50-ish if they’d like, as the UUP runs into the 10-day ema.
- $27.95 stop-loss.
- CHNG — Trimmed a little over ⅓ of position into our first target of ~$24.50. Inching stop-loss up to $23.50. Conservative bulls go with a break-even stop.
- Next target: $25 to $25.30
- O — Hit our second target at $75-plus. Now B/E stop or $72.75 for more conservative traders.
- LNG — I have received a few messages on LNG from the previous update. $155 was the first trim. $160 is a reasonable second trim. $165+ on the rest.
- B/e or profitable stop from here.
Relative strength leaders (List is cleaned up and shorter!) →
- CNC
- HRB
- ENPH — kickstarted the rally in Solar
- TAN
- FSLR
- LNG
- PWR
- CHNG
- COST
- PEP — trade is live
- BA
- UNH
- XLE
- MCK — trade is closed
Economic Calendar

As we all know, there’s no crystal ball when it comes to trading stocks, options, or futures. But the Market Imbalance Meter may be as close as it comes. Knowing how the “Big Money” is placing its bets can give our trading room a big wave to ride — or a warning sign to stay out of the water. Come check it out now, risk-free for 30 days.
Comments are closed