Our View
Many traders think the stock market has made its low for the year and point to the Nasdaq’s 20% climb since the middle of June as their proof. They say the “longest bear market” since 2008 is over and point to the recent jobs report and last week’s drop in the consumer price index (CPI) as proof that the worst is now behind us.
But that is not going to stop the Fed from raising rates and tightening its monetary policy.
On Wednesday, the Commerce Department is set to release its monthly retail sales report for July, with economists expecting headline sales to rise 0.1%, a modest increase after climbing 1.0% in June.
On the earnings front, retail heavyweights are set to report second-quarter results, beginning with Walmart on Tuesday. The megastore’s latest financials will come just weeks after the company slashed its forecast and announced plans for corporate layoffs and restructuring. Target, Home Depot, and a bevy of other retailers will follow suit later in the week and then the August options expiration is on Friday.
Our View
All three major stock benchmarks gained last week, with the Dow rising 2.9%, the Nasdaq Composite up 3.1% and the S&P up 3.3%. Nearly 90% of stocks in the S&P are now above their 50-day moving average.
It marked the S&P 500’s first four-week win streak since November 2021. We never had a four-week win streak in the SPX during the Great Financial Crisis bear market, although there were three in the dot-com bear market (in April 2001, July 2002 and October 2002).
Our Lean
According to the Ned Davis S&P cash study, the Monday before the August options expiration has been up 27 / down 11 of the last 38 occasions (71%). Historically, Monday is by far the strongest day of the week for the August expiration, but after the S&P’s 1.73% gain on Friday, more gains may be tough to come back today.
Here is the link for both the S&P and Nasdaq for the week and into next Monday.
If the ES gaps up on the open, my lean would be to sell into it and look to buy the pullbacks. Otherwise, I’m sticking to what’s been working: Buying the 50 to 70 handle pullbacks. 4235 to 4240 in the ES is my first zone of interest, then 4200 to 4210.
I will say one thing: Everyone is bullish now and the ES has rallied 640 points off its low and the NQ is up a whopping 2500+ points. Do I think the ES can go higher? Yes, but I also feel quite certain that there will be some type of pullback soon.
Daily Recap

The ES traded 4231 on Friday’s 9:30 futures open, climbed ~8 points then sold off down to regular-session low of 4221 at 10:00. From there, it climbed 28 points up to 4248 and chopped in a five point range for the next hour. Just after noon, it broke out and never looked back.
Shares rallied 39.25 points to the session high of 4282.75 after the 3:50 cash imbalance flipped from $450 million to sell to a high of $2.4 billion to buy.
The ES settled at 4280.75 on the 5:00 futures close, up 71 points or up 1.96% on the day. We could have added more to the recap, but I think the chart says it all.
In the end, the only thing I can say is it’s a dip-buyers market. In terms of the ES’s overall tone, Goldman said on Wednesday, “With the aggressive move higher, today CTA’s (commodity trading advisors) need to buy an additional $11 billion is S&P stocks over the next 5 days.” In terms of the ES’s overall trade, volume was low at 1.22 million contracts traded.
- Daily Range: 74.5 points
- H: 4282.75
- L: 4208.25
Technical Edge
- NYSE Breadth: 85% Upside Volume (!)
- NASDAQ Breadth: 78% Upside Volume
- VIX: ~$21
Game Plan: S&P, Nasdaq, Bonds, Dollar
Coming into this week, the falling volume yet rising indices keeps in a “cautious bull” state. Put another way, we’re looking to buy the dips rather than sell the rips or buy the upside rotations.
Keep an eye on BMRN and HWM, which we flagged on Friday, as well as CYTK from a prior update.
From here, the debate is beginning to rage about whether we’ve seen the low and the bulls are back, or if this is simply a vicious bear market rally and we have one (or more) legs left on the downside. I don’t think anyone can say with 100% confidence that either scenario is true, so we’ll just go one level at a time.
I really would like to see a little bit of the hot air come out of the market, if not just to assess how aggressive the dip-buyers are. We have the FOMC on Wednesday, with no rate decision attached to it, then Jackson Hole later this month.
S&P 500 — ES

Thursday’s action was ugly, but Friday’s action was powerful and with it, the market remains in a buy-the-dip state.
I would love a pullback to 4170-ish in the ES. There we have prior resistance, the rising 10-day moving average (active support) and the weekly VWAP. That’s a great spot for active bulls to step in and buy.
If we continue to push higher, the 61.8% retrace near 4360 is on the table, which comes into play just above the 200-day and 50-week moving averages. This area should be a trouble spot in the short-term for the bulls.
S&P 500 — SPY

Same thing with SPY, with the BTD spot sitting near $416.50 to $417.
The 61.8% comes into play near $435.
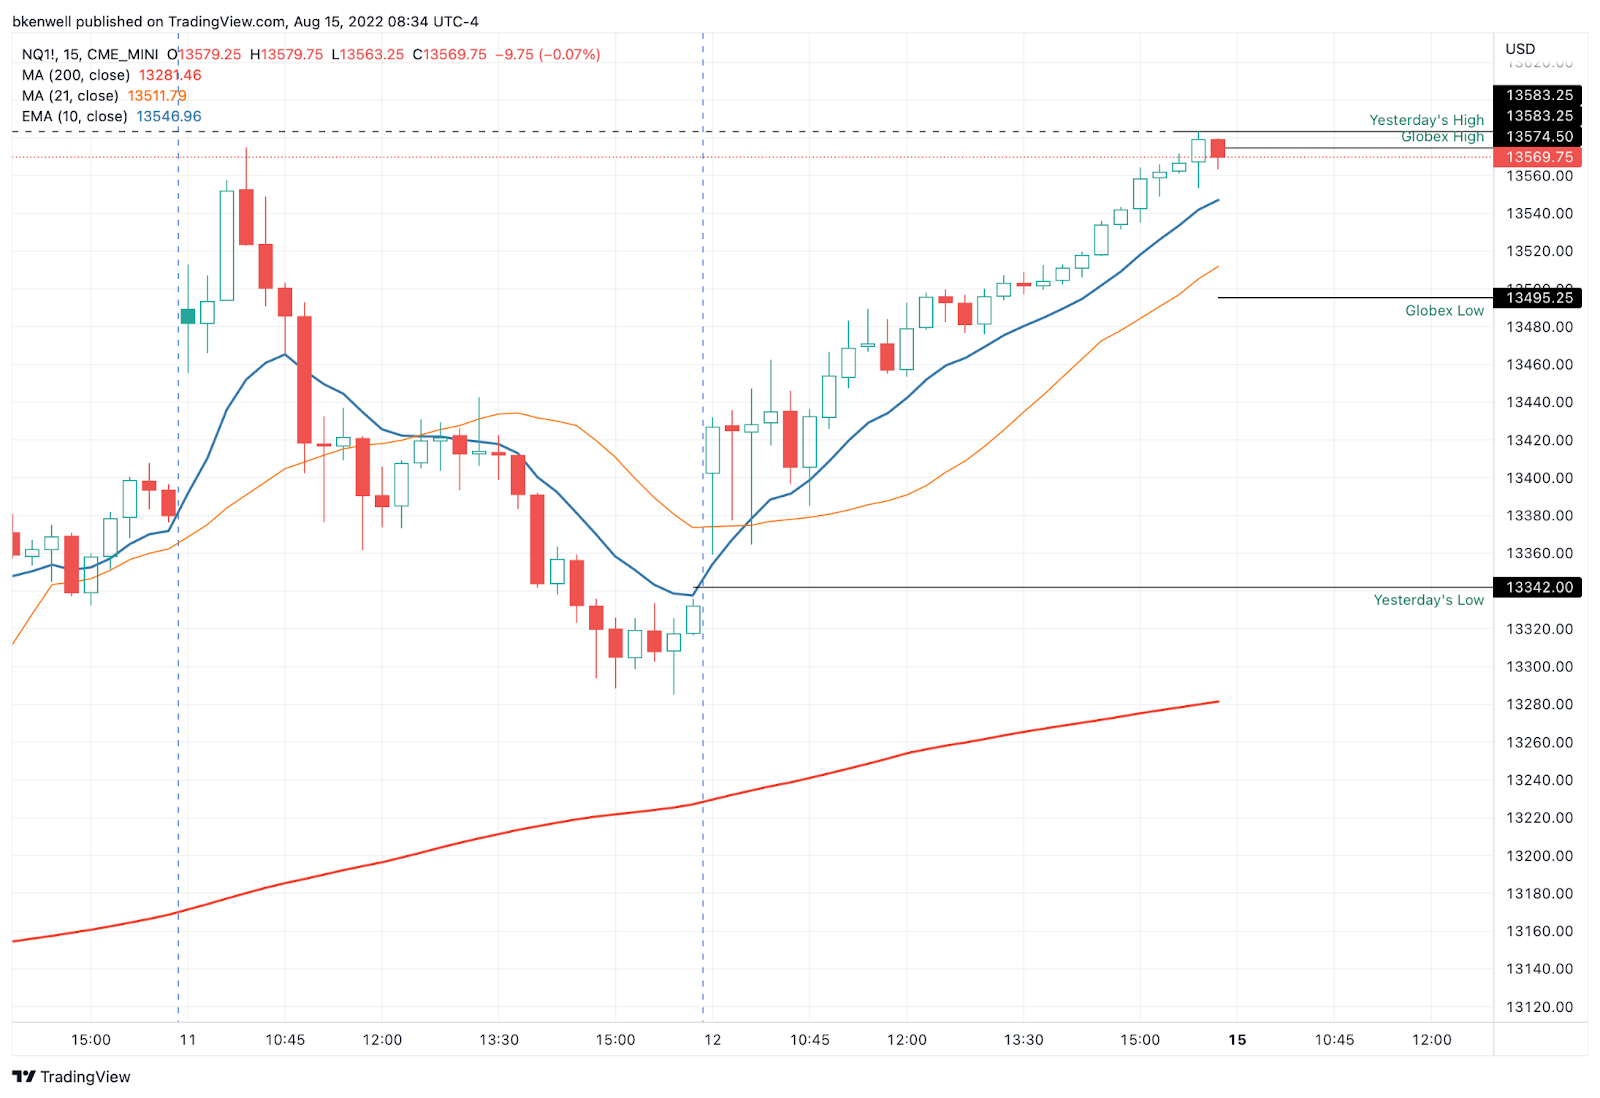
Nasdaq — QQQ & NQ

Above is the QQQ, below is the NQ (using regular-hours trading, not Globex).
The QQQ and NQ are trading near the 10-ema on the 15-minute chart as of about 8:30 ET. If we open here, let’s see if active bulls grab control and buy the dip. If so, that could give us a quick cash-flow trade this morning.
If not, we may need to let a little more steam come out before stepping in. At the very least, it’s an area to watch.
TLT

Bonds did poorly last week and actually logged their third straight weekly loss. That came after falling on Tuesday, Wed. and Thursday.
The TLT bounced on Friday and we’re rallying again in the pre-market. The level to watch?
Last week’s low at $114.09. A break of this level that’s not reclaimed could put the $112s in play and further raise some suspicions that more downside may be on the way.
UUP

The dollar has a little pep in its step this morning. I want to see if this can go weekly-up over $23.47 — call it $23.50 — and push into the first price target zone we’re watching in the $28.60 to $28.80 area.
Go-To Watchlist — Individual Stocks
*Feel free to build your own trades off these relative strength leaders*
- Numbered are the ones I’m watching most closely.
- Bold are the trades with recent updates.
- Italics show means the trade is closed.
Trade Sheets: Now have 2-3 live trades, all with breakeven or better stop-losses. Great stress-free position to be in as we try to squeeze a bit more of upside out of this move.
- PEP — We got out Target No. 2 at $177. Either all out now or down to ⅓ of a position if playing for a breakout. Stop at $172 (above B/E).
- UUP — $28.60 to $28.80 is ideal trim zone, but bulls can trim ¼ at $28.50-ish if they’d like, as the UUP runs into the 10-day ema.
- $27.95 stop-loss.
- CHNG — Trimmed a little over ⅓ of position into our first target of ~$24.50. Inching stop-loss up to $23.50. Conservative bulls go with a break-even stop.
- Next target: $25 to $25.30
- O — For anyone in it, $74 target hit, B/E stop. $75+ is next area for trim.
Relative strength leaders (List is cleaned up and shorter!) →
- CNC
- HRB
- ENPH — kickstarted the rally in Solar
- TAN
- FSLR
- LNG
- PWR
- CHNG
- COST
- PEP — trade is live
- BA
- UNH
- XLE
- MCK — trade is closed
Economic Calendar

As we all know, there’s no crystal ball when it comes to trading stocks, options, or futures. But the Market Imbalance Meter may be as close as it comes. Knowing how the “Big Money” is placing its bets can give our trading room a big wave to ride — or a warning sign to stay out of the water. Come check it out now, risk-free for 30 days.
Comments are closed