Stocks aren’t being overwhelmed by sellers, but lack buyers.
Please sign up for our free webinar discussing the end of the year happening this Saturday (9/10 at 11:00 EDT). The signup link can be found here. I really hope to see you there!
Our View
The S&P has fallen over 10% from its August peak and many traders that thought the big summer rally would lead to higher prices are now reassessing their views of the stock market. They are now under the mindset that it was just another big dead-cat bounce and thinking that inflation could continue higher over the next year.
All I know is that the S&P rallied over 600% from its March 2009 low and rallied 121% from its March 2020 low. As I write this, the S&P is only down 18% from the highs after last year’s 27% gain.
As I’ve always said, “no one knows for sure what the S&P is going to do,” and I’m usually a bull (Why fight the long-term stats?). With that in mind, I can’t rule out some further bounces, but I still see a larger decline coming.
According to Ben Laidler, eToro Global Markets Strategist:
“Sentiment is at financial crisis lows and however bad you think this is, that’s not it. The inflation fever is beginning to break. Corporates, and consumers for now are remaining remarkably resilient. It won’t last forever, but the US economy is re-accelerating right now.”
The S&P is down in six of the last seven sessions, but three of those sessions were marked by losses of less than 1%. It almost feels like a lack of buyers vs. outright and relentless selling.
My take? I think we can bounce, but right now the trend is down and that means we sell the rallies. The big question is, do we retest the low and if so, when?
Our Lean
3900 is the line in the sand and until the ES closes below it, I think you just have to keep selling the 40 to 70-point short covering rallies. That said, when you look at the chart it looks like the ES did a lot of back-and-filling yesterday and I can’t rule out some sort of bounce.
We are flirting with moves below 3900, now making the 3880 to 3885 zone critical to hold. Beware of a break of this 5-point range that’s just a “look below” — where the ES trades below this level, then reclaims it and bounces.
Regardless, 3920 has been resistance. Above 3923 puts 3950 to 3960 in play, then 4000. More below in the technicals.
Daily Recap

The ES traded up to 3963.25 and opened Tuesday’s regular session at 3934. After the open, the ES traded up to 3944.25 and then collapsed down to 3886.75 at 10:13 — the session low. From there, it rallied up to 3898, pulled back down to 3889, and then ripped all the way up to 3943.25, a 56.50 point rally off the low.
After the high, the ES sold off down to 3921 and then rallied up to a lower high at 3942.25 at 11:42 and dropped ~35 points down to 3906.75 at 12:26. After another failed rally attempt up to 3926.25 at 12:58, the ES sold off down to 3893.75 at 1:16, rallied up to 3906.75, retested the prior low at 3993.75 at 1:54 and then rallied up to the VWAP at 3920.25 at 2:16.
The ES sold back off down to the 3901 area and rallied back up to the VWAP at 3920.75 as the early MIM showed $80 million to buy but struggled for upside traction as the final tally ended up closer to $1 billion for sale, as it settled at 3908.25, down 28 points or 0.71%.
In the end, the ES continued its downward trend. In terms of the ES’s overall tone, the index sell programs ruled the day. In terms of the ES’s overall trade, volume was high at 2.3 million contracts traded.
- Daily Range: 76.50 Points
- High: 3963.25
- Low: 3886.75
Technical Edge
- NYSE Breadth: 32% Upside Volume
- NASDAQ Breadth: 37% Upside Volume
- VIX: ~$26.85
Game Plan: S&P, Nasdaq, Bonds, Individual Stocks
Remember, Apple has an event at 1 pm ET. That could be a big driver for the overall market (in both directions)!

S&P 500 — ES
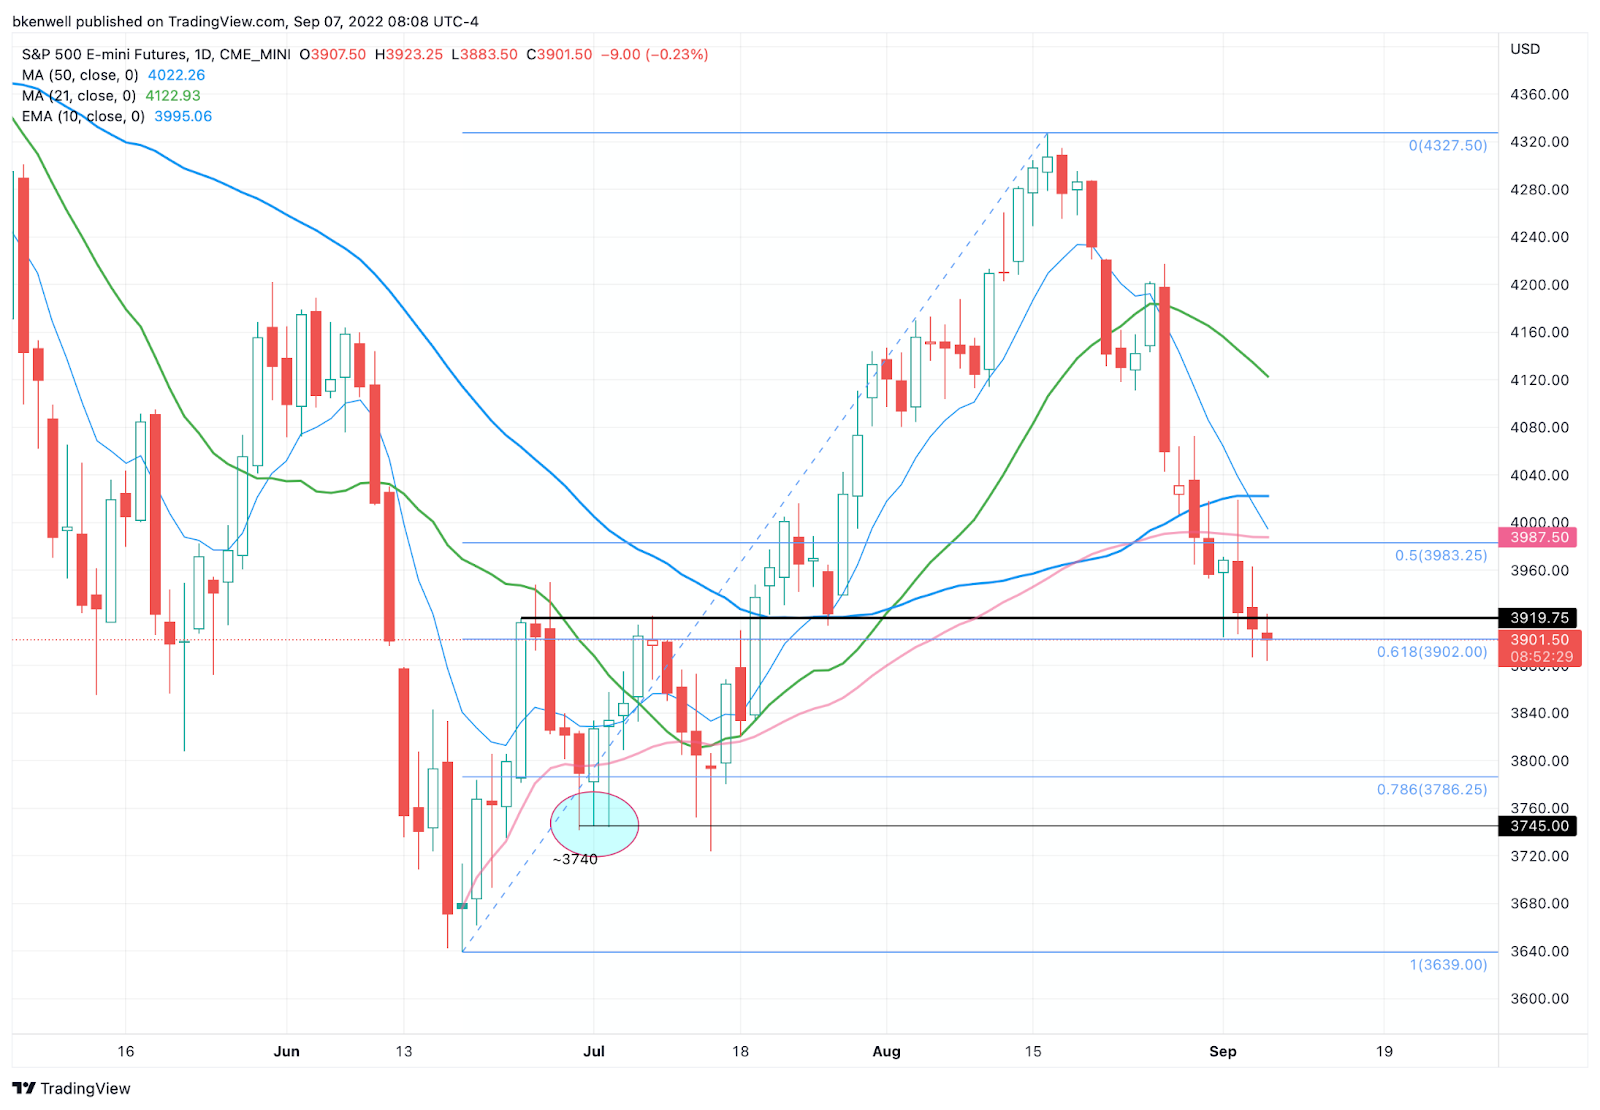
We are not plunging lower necessarily, but little by little, day by day, the S&P seems to be losing another level.
It’s barely holding 3900.
Yesterday we had a look-below 3900 and the Thursday/Friday low before bouncing and closing back above these marks. We aren’t suffering the traumatic price action we did earlier this year (or at least not yet) and down 6 of the last 7 makes it hard to “sell into the hole.”
But I am just having trouble being a buyer here.
That said, a move over 3925 could put 3960 in play, while 3990 to 4000 looks like a potential brick wall for now. They are selling the big 100 to 120 point bounces. If we get that over the next day or two, it could be another opportunity on the short side.
For now, 3883 to 3886 is a big zone. If we lose that area and can’t reclaim it, the ES can continue to trickle lower. That puts the 3830s, then the 3780s in play.
SPY

I’m going to make this much simpler than the ES.
I’m a seller at $400 to $402 and $389 to $390 has to hold as support. A close below this area opens the door down to the $377 to $379 area.
Nasdaq — NQ

Nothing of interest in the NQ unless it reclaims 12,100 and stays above it. If it does, 12,200 to 12,250 could be in play. Above that opens the door to 12,375.
On the downside, sub-11,925 could open the door to the 11,600s.
Again, down 6 of the last 7 (with the one “green day” being a 0.06% gain) and it’s hard to be an outright seller at this point unless the low gives out.
Nasdaq — QQQ

Struggling to hold $294, the QQQ could be on tap to test the $287.50 level then the $280 to $283 area if buyers don’t step up.
On the upside, over $296.50 puts $300 in play.
TMUS
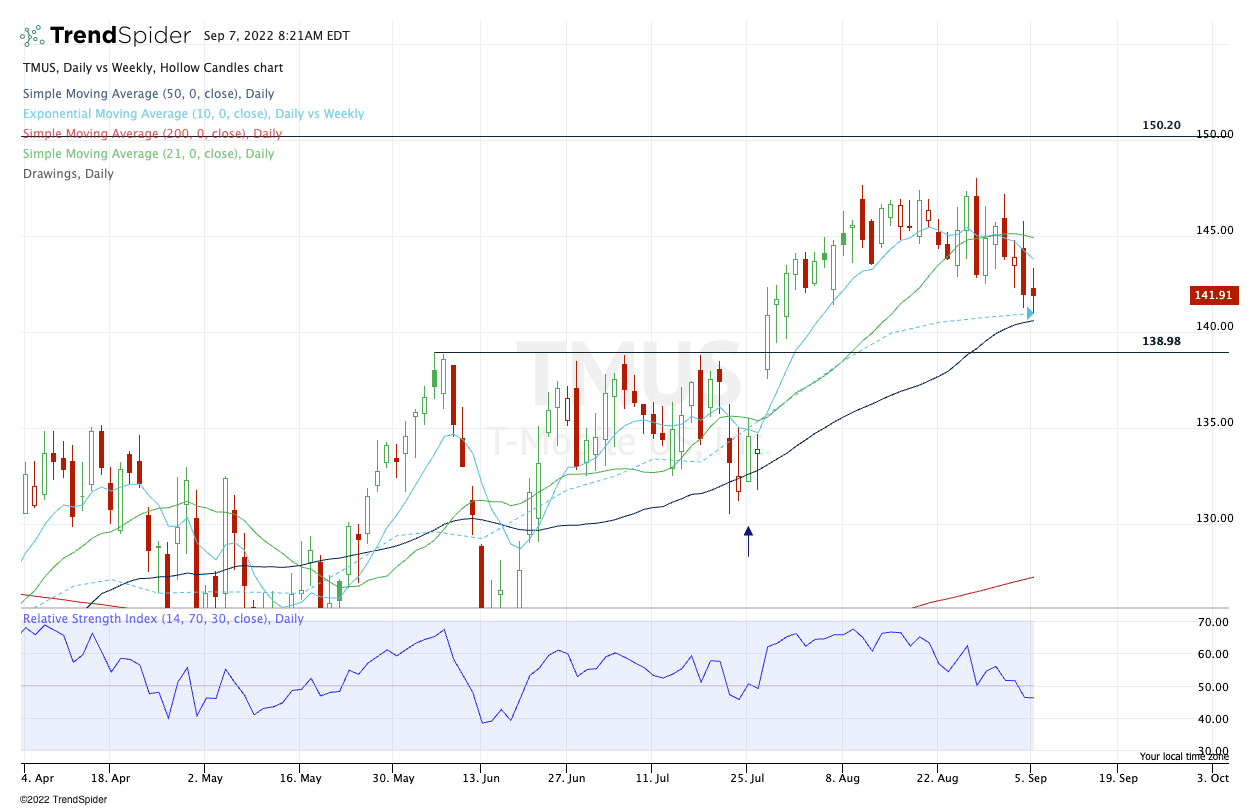
Aggressive buyers could be long from yesterday’s tag of the 10-week. More conservative traders will wait for a tag of the 50-day and/or the breakout level.
Either way, keep the $137.50 area in mind. That’s a decent area for a stop.
CHRW
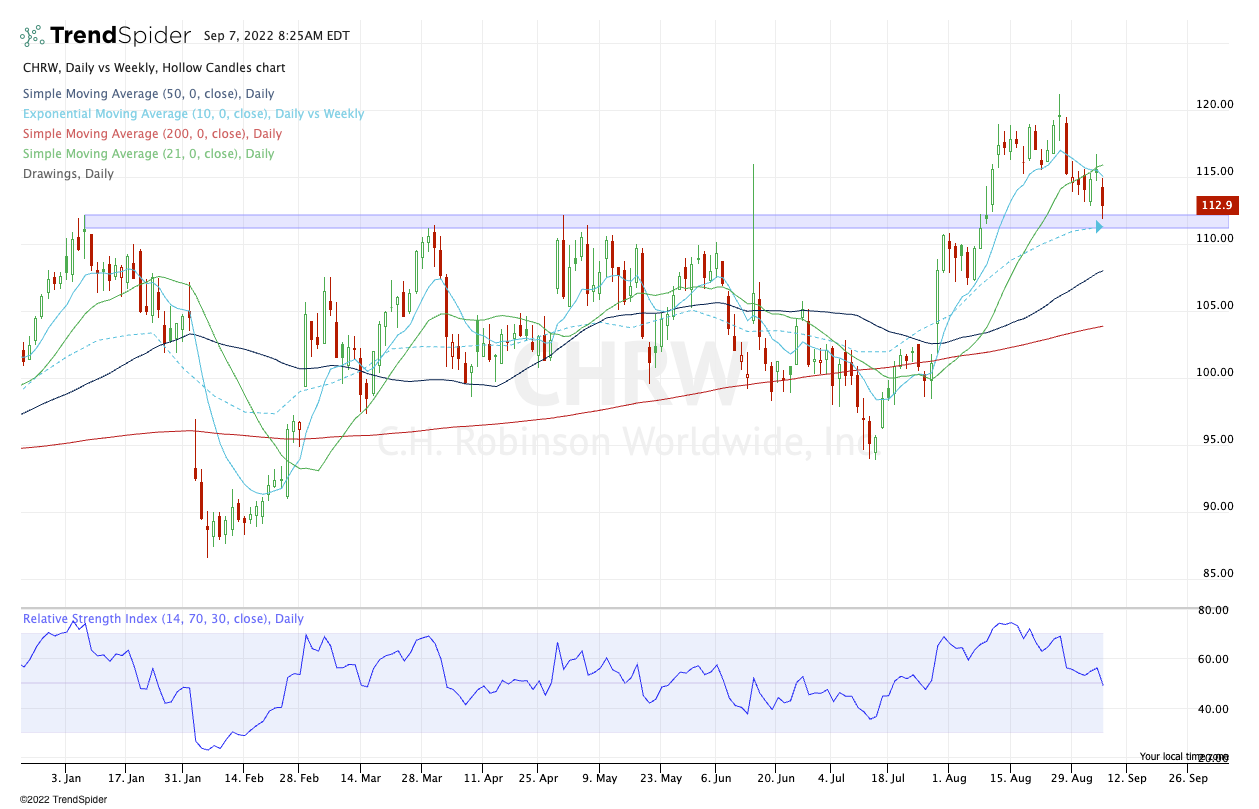
A little too low on the volume scale for me, but this chart is enough to attract a few buyers. A break of yesterday’s low and reclaim would be a decent setup.
Risk: $106.50.
CELH

From the relative strength list below, CELH has a decent setup in the $89 to $91 zone.
Go-To Watchlist — Individual Stocks
*Feel free to build your own trades off these relative strength leaders*
- Numbered are the ones I’m watching most closely.
- Bold are the trades with recent updates.
- Italics show means the trade is closed.
For those that want to preserve their gains, feel free to exit any position below, as many are a ½ positions or less. However, these continue to hold up pretty well.
- UUP — Down to ¼ position as we hold for potentially higher prices. Raise stops to $28.40 to $28.50. Look for $30 on the last piece.
- CHNG — second target of $25 hit. Now down to just ⅓ position. Take all profit here or move to a B/E stop and look for $25.50.
- Still looking for $25.50 on the upside.
- Feel free to raise stops to $24.50 (just below last week’s low) and those who added can even trim a little at $25 if they feel so inclined.
- OXY — I’m looking for $75 to $76 as our first trim spot. On the downside, I actually like this one a dip down to $66-ish. So consider leaving room to add.
Relative strength leaders (List is cleaned up and shorter!) →
Top:
- CAH
- TAN
- ENPH
- FSLR
- LNG — Looking for a retest of the $150 area!
- CNC
- F
- XLU
- XLE
- OXY
- BMRN
- PWR
- CHNG
- CELH
- COST
- UNH
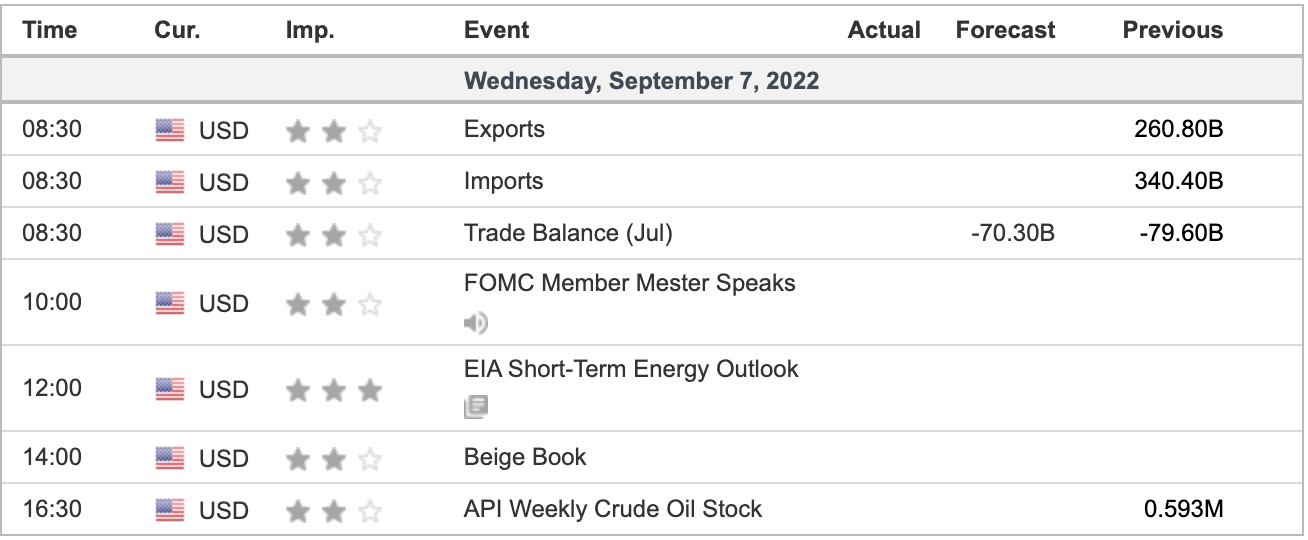
Economic Calendar
A lot of Fed speakers today between 9:00 and 2:00, FWIW. (not listed below)
Comments are closed