Our View
Short weeks are never easy for us traders.
As we get closer to next Saturday’s webinar, I thought it would be a good time to explain why MrTopStep is a cut above the rest. I know some will disagree, but there is no way one trader can keep up with all the news, the erratic price action, fighting thousands of algos or automated trading systems and the 50 and 100-point swings.
At some point no matter how good you are, you will end up on the wrong side. It was great blasting into the chat from the floor because of all the ‘flow’ that was constantly hitting the desk. We knew when the programs were going off because I was doing them. We knew the big orders were hitting and where the stops were because we were working the orders…but today there is no trading floor.
In order to get that flow back, we have LiveSquawk London pumping news into the chat, and several very good traders posting live trades all day. There is no main person, it’s a ‘collective of traders,’ and next weekend they will all be showing the webinar guests what they do to make money.
The webinar is completely free and will be next Saturday morning. The signup link can be found here. I really hope to see you there!
Our View
Short weeks can be tough because everything needs to be piled in in 4 days. After a strong summer rally, things started to unravel at the end of August, and Friday’s better jobs number was met with a 2.8% drop off the high. That’s also after Fed Chairman Powell said earlier in the month that they were going to continue to aggressively raise interest rates.
From its 4327.50 high on August 16th, the ES sold off 424 points to its low on Thursday, rebounded ~115 to the Friday high and then reversed. The move lower leaves the ES just a handful of points below the current low of 3903.50.
This week has a small number of stocks reporting earnings, while Apple will host a product launch on Wednesday. However, it’s a big week for economic reports. Today is the ISM number for August, the Fed’s beige book is on Wednesday, and Initial Jobless Claims are on Thursday. And last but not least, the ECB is forecast to raise the interest rates by .75 on Thursday, a day that Powell will also speak, followed by the Fed’s Mester speaking on Friday.
Our Lean
I told the PitBull I thought the ES could go up a little after Friday’s mini-crash. If you take Friday high at ~4020 down to the 3906 low, the 50% retracement comes in at ~3963. The 61.8% is at 3976, so this zone — the 3963 to 3976 area — could very well be resistance.
Like I said above, short weeks can be busy and the day after Labor day usually marks the end of vacations and back to work. I think the ES is oversold and could bounce, but for now, I’m back to thinking that the rallies won’t hold.
On the downside, 3920 is of note for support, but 3900 is big. A break of that without a reversal back to the upside could trigger the sell-stops.
Daily Recap

I’m going to recap Friday’s action quickly, then touch on Monday’s holiday session.
The ES was holding the 3960s during Friday morning’s Globex session, then exploded higher after the jobs report, rallying more than 40 points into the 9:30 open, where it traded 4006. The ES quickly pulled back 33 points in the opening 40 minutes, then rebounded 46 points to new highs, at 4019.25.
The ES chopped between 4006 to 4020 for the next several hours, opening at 4015 at noon. However, that kickstarted a near-100 point decline, with the ES trading 3925 at 1:30.
The 20-point rallies were being sold and the ES broke to new lows at 3906 shortly after 3:30, then rebounded to 3925.50 at the 4:00 close. It ended the session lower by 44 points or 1.1% and down more than 90 points off the session high.
Despite the volatile session, the ES opened at 3929 during Globex and traded in a tight range on Monday’s holiday session, with 3920 continuing to hold as support, while 3935 to 3940 was resistance. There were a lot of little 10 to 20 point moves, but for the most part, the ES was mostly rangebound.
Technical Edge
- NYSE Breadth: 42% Upside Volume
- NASDAQ Breadth: 33% Upside Volume
- VIX: ~$25.50
- Again, interesting that the VIX didn’t spike on Friday.
Game Plan: S&P, Nasdaq, Individual Stocks
We had a hugely successful trade on Thursday, so we went into Friday in a good position, noting that an up-move “may eventually just be a rally to sell.”
That said, I didn’t expect the rally to fail quite that badly on Friday. The markets held a very key area on Thursday (which was our buying opportunity) and rebounded nicely into the jobs report at 8:30 a.m. on Friday.
The report was considered “Goldilocks” print by many, threading the needle to please the Fed’s rate-hiking spree. That rhetoric lasted all of a few hours before the S&P reversed sharply and dove back down to the lows.
Now it’s the bulls who again quickly find themselves backed into a corner. There’s a clear risk level to hold and clear resistance to clear. Let’s look at where.
S&P 500 — ES

Remember early last week when we were looking for support from three key measures? They were the 50% retracement, the 50-day moving average and the VWAP anchored back to the 2022 low.
Look at Wednesday’s action, where it was rejected. Then look at Friday’s action after the jobs rally — also rejected.
Support is turning to resistance, the rallies are being sold and bulls find themselves looking for “juuuuust a little bit more upside” that doesn’t seem to get there. That’s bear-market action.
As for key levels, bulls need to clear 3975 on the upside, then 4000. That opens the really key level of 4020, which rejected the ES on Friday and at least for today, it’s where we find the 50-day and 10-day moving averages.
On the downside, isn’t it pretty clear? 3900 is key support. If it fails and the ES can’t regain it, the 3830s could be in play next, then the 3780s.
SPY

Friday’s action looks even worse when we look at the SPY.
It’s pretty simple here: The SPY needs to hold the $390 area. It’s the two-day low and a very key area on the chart. Not only as support/resistance, but it’s near where the 61.8% retracement comes into play.
Today (or the next few days) could be setting up as observation days where we wait to see if and when the moves lower or if the bulls can muster up a move over resistance (for the SPY, that’s over $400 to $403).
Nasdaq — NQ
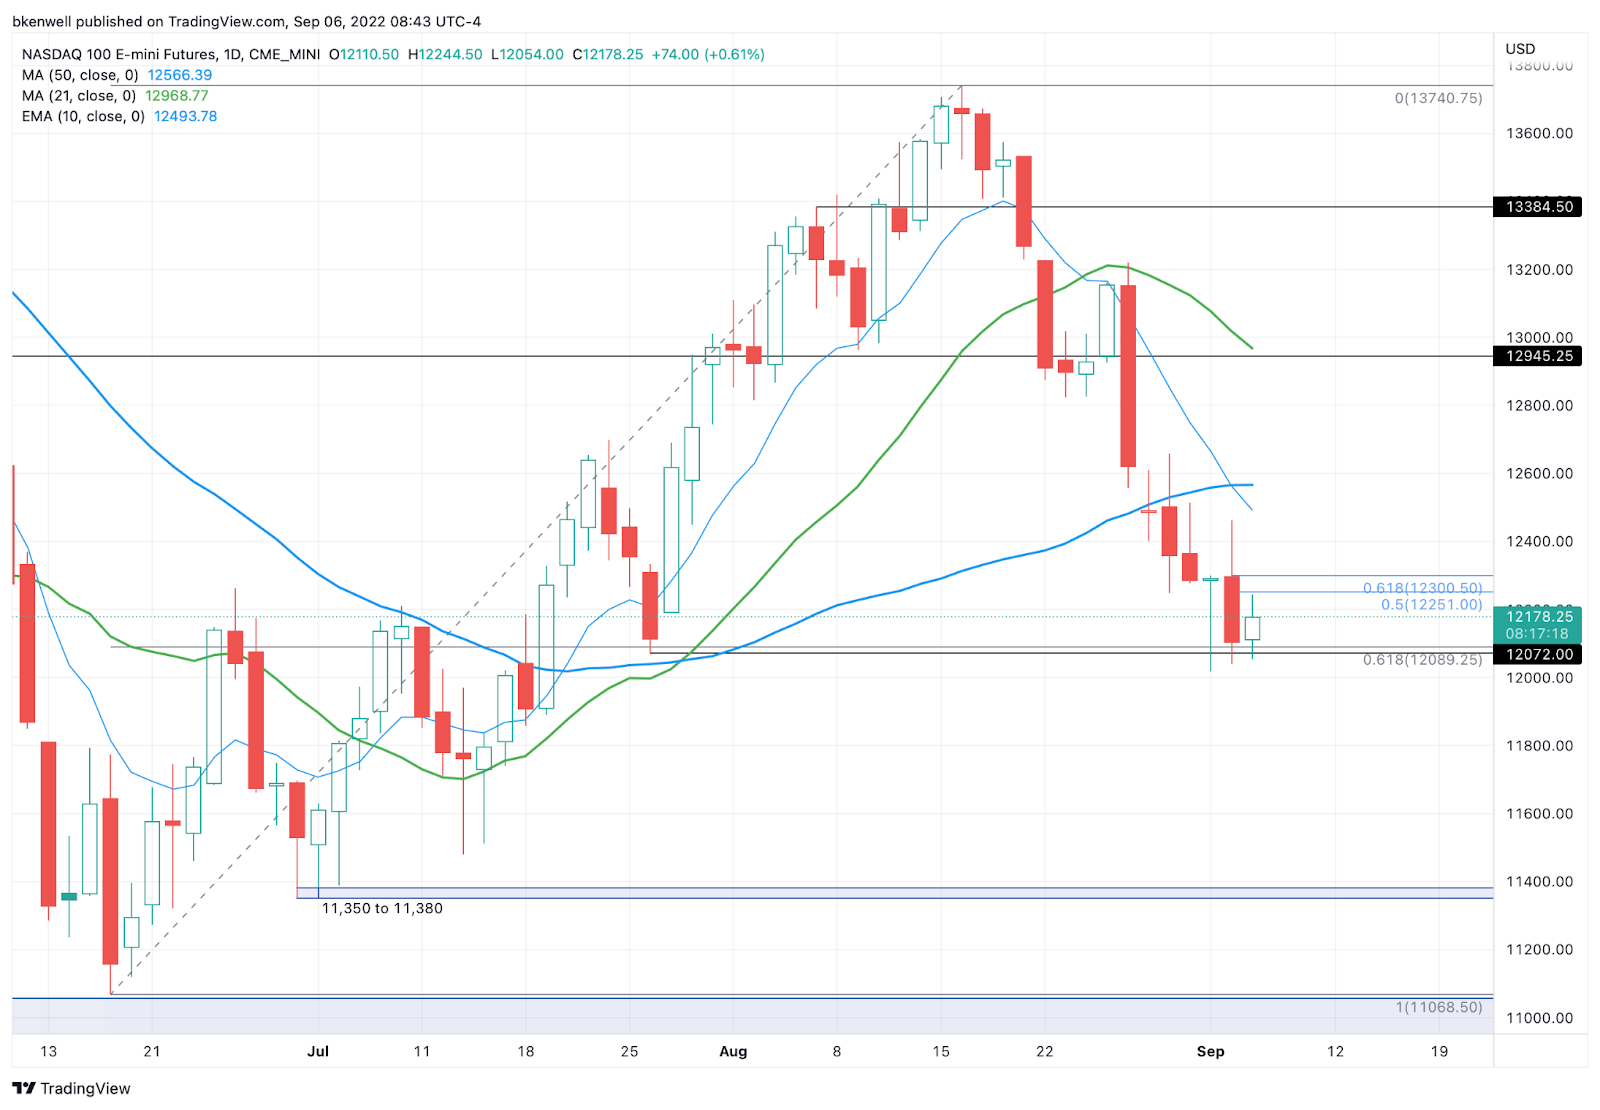
As highlighted last week, key support sits between 12,050 to 12,100.
On the upside, I’m watching 12,250 to 12,300 as resistance. I love it when it’s nice round numbers, but more importantly, that’s the 50% to 61.8% retracement zone from Friday’s range.
Above that could open the door to the 12,400 to 12,500 area and the 10-day moving average, but this zone was resistance last week for the NQ and it now sits in a “prove-it” situation for the bulls.
AKA, the benefit of the doubt rests with the bears and selling the rallies until proved otherwise.
Nasdaq — QQQ

The QQQ needs to hold the $294 area. A break and failure to regain this level opens the door down to the $280 to $283 area.
On the upside, we need to see the QQQ regain $300+
$303.50 to $306 looks like stiff resistance for now.
TMUS

There’s not a lot out there that looks juicy to buy. Energy is holding up, but we need a bid in oil for those to fly.
As for TMUS, $140.50 marks the 10-week and 50-day moving average. Just below that is the $139 breakout level. I’ll likely take a shot somewhere in this range FWIW.
Go-To Watchlist — Individual Stocks
*Feel free to build your own trades off these relative strength leaders*
- Numbered are the ones I’m watching most closely.
- Bold are the trades with recent updates.
- Italics show means the trade is closed.
For those that want to preserve their gains, feel free to exit any position below, as many are a ½ positions or less. However, these continue to hold up pretty well.
- UUP — Down to ¼ position as we hold for potentially higher prices. Raise stops to $28.40 to $28.50. Look for $30 on the last piece.
- CHNG — second target of $25 hit. Now down to just ⅓ position. Take all profit here or move to a B/E stop and look for $25.50.
- Still looking for $25.50 on the upside, but can be back up to a ½ position or more $24.73. $24.25 is a reasonable stop-loss for those that added.
- Feel free to raise stops to $24.50 (just below last week’s low) and those who added can even trim a little at $25 if they feel so inclined.
- OXY — I’m looking for $75 to $76 as our first trim spot. On the downside, I actually like this one a dip down to $66-ish. So consider leaving room to add.
Relative strength leaders (List is cleaned up and shorter!) →
- XLU
- XLE
- OXY
- CNC
- F
- BMRN
- APLS
- ENPH
- TAN
- FSLR
- LNG
- PWR
- CHNG
- CELH
- COST
- UNH
Economic Calendar

Comments are closed