Our View
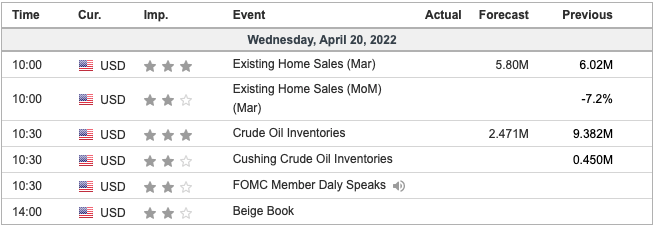
The bonds didn’t matter yesterday, but it looks like they do this morning. The ZB (bonds) rallied 2 full points from 138.14 to 140.16. The ES sold off down to 4432.75 on Globex but is now trading 4463 at 7:00 am. This morning’s economic reports include MBA Mortgage Applications and Existing Home Sales. TSLA reports earnings after the close, which like NFLX, could move the futures in after-hours trading.
Our Lean
It didn’t take long to figure out the ES was going higher yesterday and I think it will follow through on the upside — at least for part of today. As such, I’m long the ES from the 4439.50 level.
On the upside, look for a push over 4467, which was Tuesday’s high. That could put 25 to 30 handles of upside in play. This trade is broken down more specifically in the Technical Edge section below.
Daily Recap
The ES opened Tuesday’s regular session at 4386.75, traded down to 4385, and then the bulls took over. It rallied 21 points from the low to Monday’s high at 4406, paused with a 6-point dip, then ripped higher by another 23 points into the 4420s.
The ES rallied during six straight 15-minute windows to start off the day and rallied in nine out of ten 15-minute windows after 9:15. Eventually it topped out at 4451.75 just before noon and drifted back down to 4435. To no surprise, the bulls stepped up again with the ES rallying ~33 points from 4433 at 2:10 to a high of 4465.75 just after 3:30.
The 3:50 cash imbalance flipped from $550 million to sell the $2.2 billion to buy. The ES printed a new high at 4467, then dropped down to 4451 at 3:56 and then bounced back up to 4458 on the 4:00 cash close. After 4:00, the ES fell hard, dropping 25.50 handles at one point after the Netflix report. Ultimately though, it gained 1.65% or 72.50 points on the day.
In terms of the ES’s overall tone, it was firm out of the gate and rallied all day but puked 34 points off the high in the face of a big MIM buy. In terms of the ES’s overall trade, volume was slightly higher all day with 1.49 million contracts traded.
- Total Range: 95.25 points
- H: 4467
- L: 4371.75
Technical Edge
- NYSE Breadth: 67% Upside Volume
- NASDAQ Breadth: 76.7% Upside Volume
The market gave bulls what they were looking for yesterday: A daily-up rotation, which allowed the S&P 500 to burst higher.
This is why we go from level to level. Yesterday’s Game Plan on the S&P was:
“If we can clear the high — 4406 — it will put the ES over the 50-day moving average as well. That puts active resistance via the 10-day in play, followed by the 4440 level. Bigger picture, above the 10-day and 50-day could open the door up to 4490 to 4500.”
Once we got above 4406, which was clear within the first 20 minutes, it opened the door to higher prices. From here, we pocket the win (or trim some and move to a break-even stop-loss) and manage it going forward.
I still remain cautious even though we’re looking for two-way action.
Game Plan
Did bonds bottom?
I honestly don’t know, but if this group fetches a bid, it should bode well for tech. Keep the TLT and/or ZB contract on your screen.
S&P 500 — ES
- Feel free to extrapolate this chart to SPY
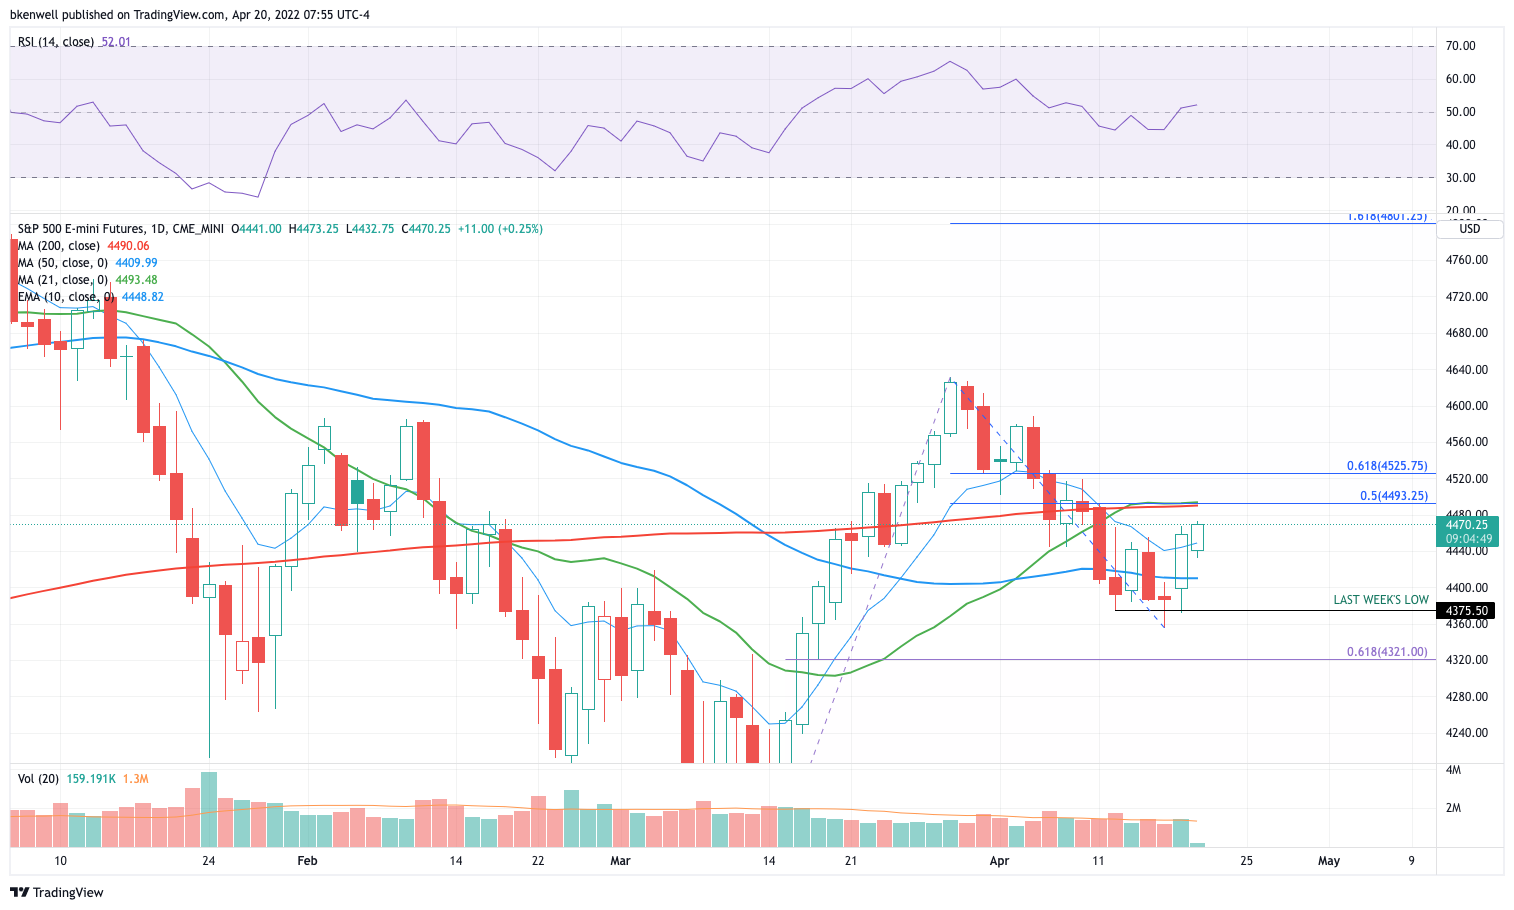
If the ES can go daily-up over 4467 and stay above this mark, it puts our next target range in play: 4490 to 4500.
Here we find the 50% retracement of the current range, as well as the 21-day and 200-day moving averages. If the S&P powers above this area, then we could see 4525.
On the downside, I want to see the 10-day moving hold as support if the ES can’t go daily-up over 4467. If the 10-day fails, the Globex low is on the table at ~4432. Below that puts 4400 to 4410 in play next.
Nasdaq — NQ
- Feel free to extrapolate this chart to QQQ
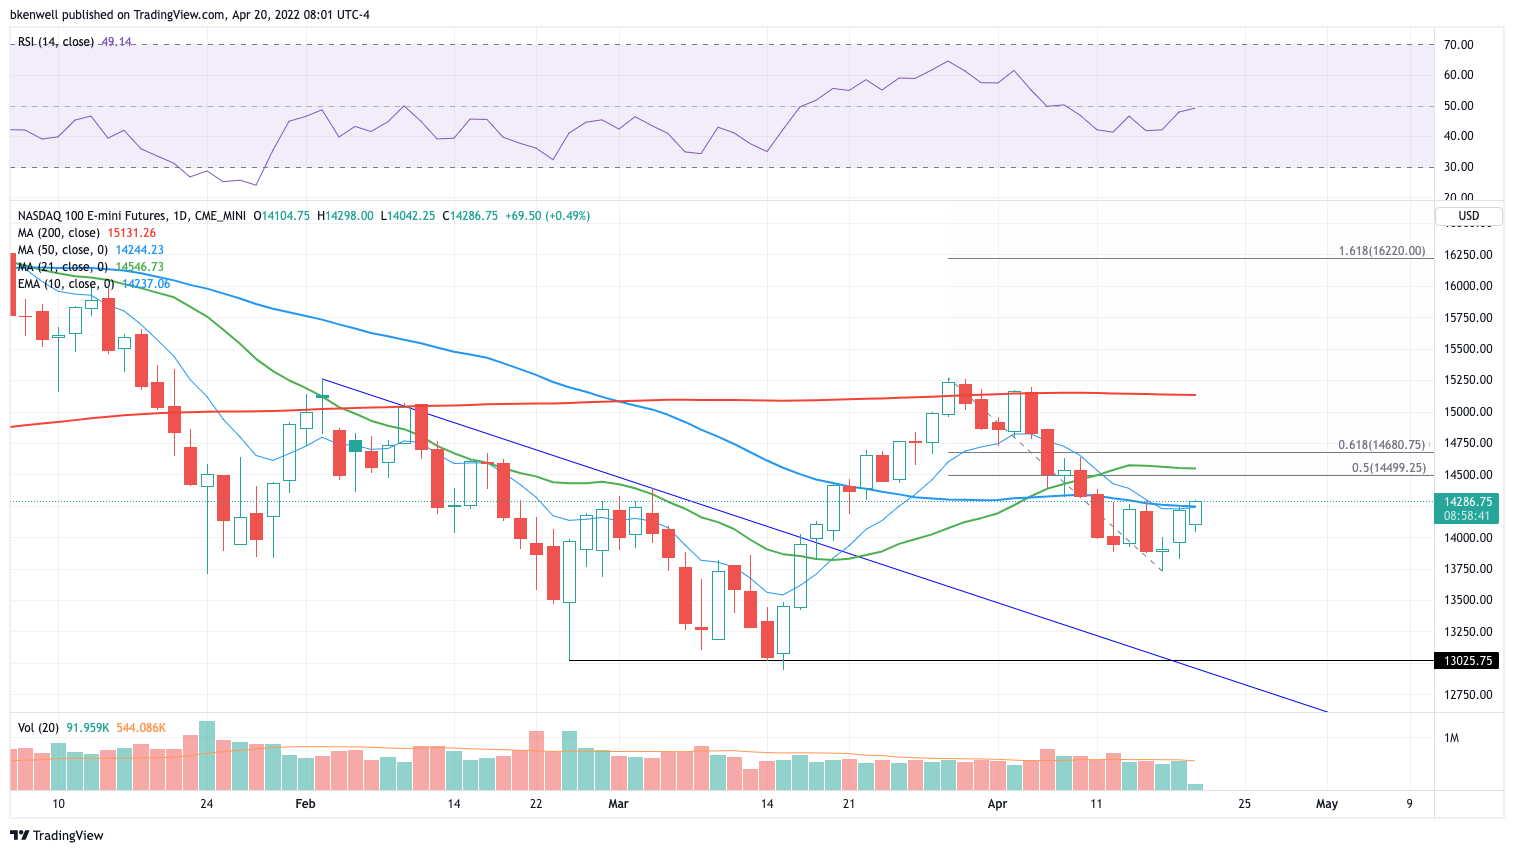
The NQ is in a very similar situation, albeit a bit weaker. A daily-doji-up rotation over 14,242 could help vault it over the 10-day and 50-day moving averages. That could open the door to 14,500.
On the downside, watch 14,200. If we can’t stay above that, the NQ may lose steam. So far, it’s shaking off the 25% pre-market decline in NFLX pretty well.
Below the Globex low of 14,042 would be an issue.
Remember, bonds have been steering the ship lately.
Bonds
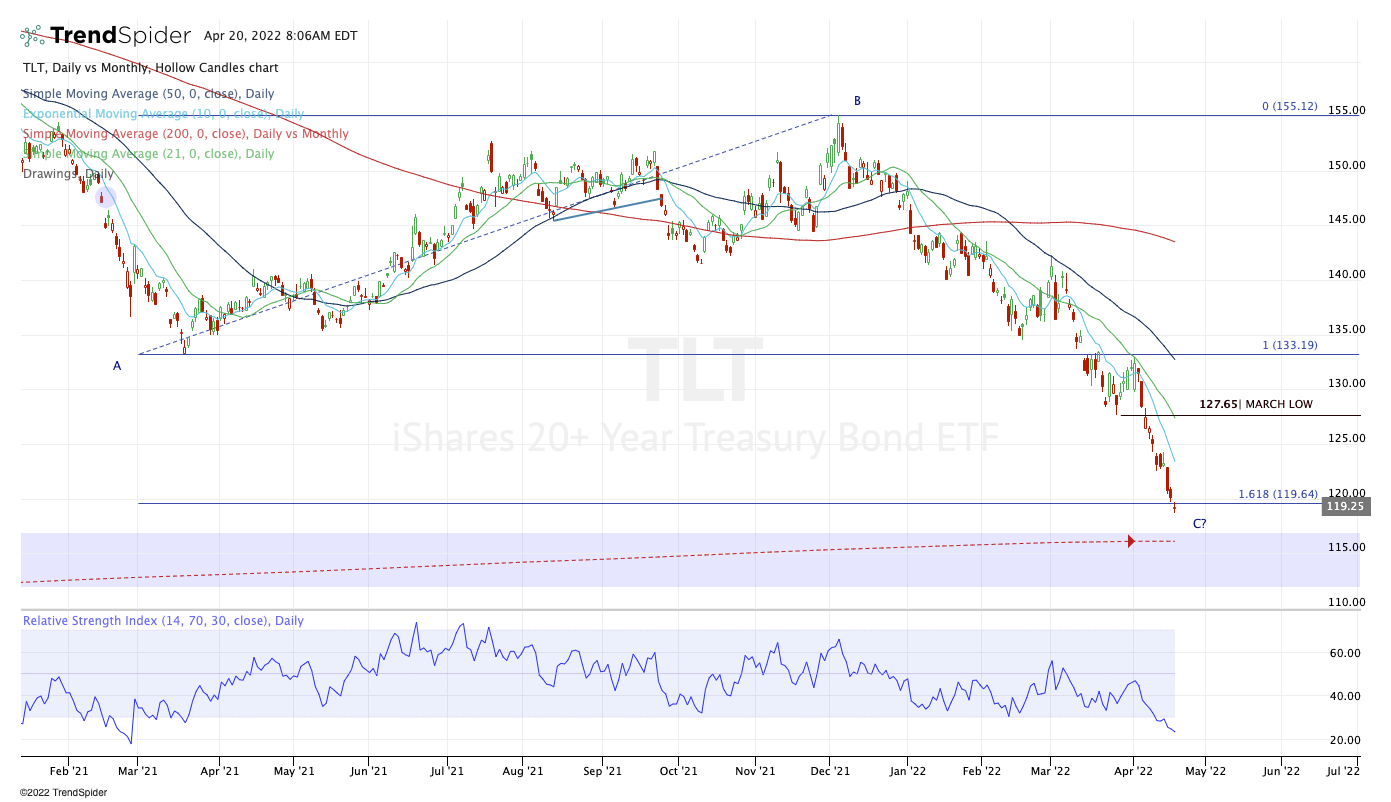
Yesterday I laid out the monthly chart of the TLT. Here’s the daily chart, which gave us a doji close on Tuesday. A doji-daily-up over $119.72 — happening in the pre-market now — could trigger a move back to the declining 10-day, currently just above $123.
If the TLT fades in the regular-hours session, see how it handles the $119.65-ish area. If it’s support, bulls remain in control.
A bearish engulfing candle — which happens on a close below $118.67 today — would be a dagger into the bulls’ hopes. A snap-back in the bonds could bode well for tech.
VRTX

We had VRTX in 3 or 4 straight newsletters, so this should have been on everyone’s screen yesterday. Look for $285 to $287 as the first trim, the second trim near $292 and finally, a full exit near $300.
FCX
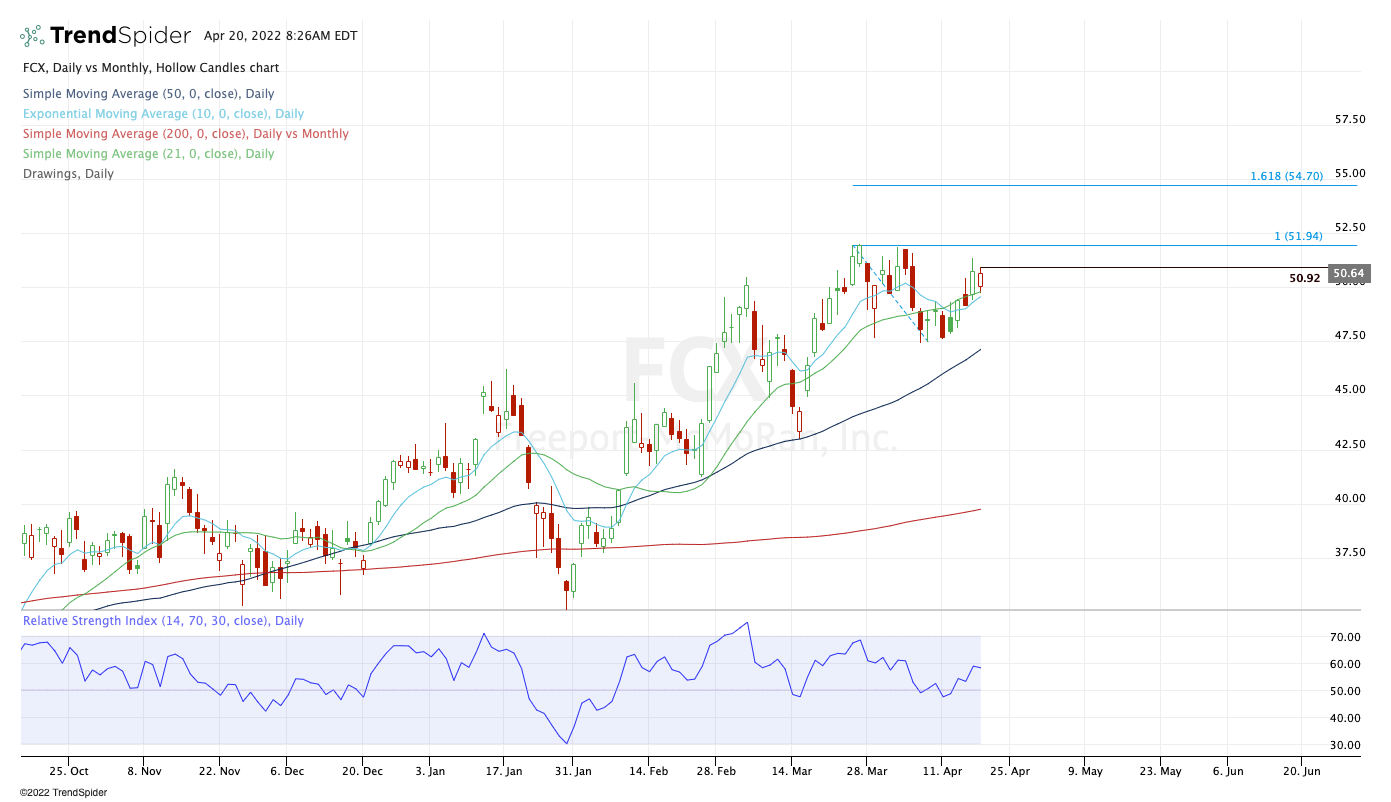
See the Materials names below (XLB), like FCX and NEM, as they have been trading well lately and have been dipping.
FCX is giving us an inside day and is above all of the daily moving averages. An inside-daily-up rotation over $50.92 that sticks, could open the door to a long position. It would put a quick trim in play near $52.
Above $52 opens the door to the $54.50 to $55 area for the second trim.
Go-To Watchlist
*Feel free to build your own trades off these relative strength leaders*
Numbered are the ones I’m watching most closely. Please look at these closely, as there are several updates (the most recent of which are noted in bold).
- COP — Triggered weekly-up at $102.50. → $107 is ideal first trim zone, but conservative bulls can do so closer to $105 if they prefer. → if you missed this the first time around, look for weekly-up again over $102.50.
- VRTX — Triggered long → First trim zone at $285 to $287, followed by ~$292 as the second trim zone.
- PANW — Trimmed into weekly-up area near $631. Still looking for $645 to $655 on the upside against a B/E stop (near $598)
- TGT — Monthly-up over $229.50 → first target ($237 hit). So B/E stop and looking for $250 on the upside → could come near today’s open
- HD — Stopped at B/E.
- WMT — Trim at $158 → B/E Stop. Inside week. Now looking for inside-and-up rotation over $158.29. If so, it puts $162 in play for small trim, otherwise $165 to $170 is our longer term target.
- ABC — $164 trim spot hit → B/E stop ($160) in effect. $166 is the next ideal trim spot. $170 to $172 would be for the final tranche.
Relative strength leaders (List is getting longer!) →
- AR — watch for test of 10-day
- COST
- MAR — back on the list
- CAT
- DLTR
- MCK
- BRK.B
- XLB — ADM, MOS, NTR, CTVA, NEM — Keep an eye on this group in the coming days.
- ABBV
- FLR
- JNJ
- XLU
- BMY
- Energy — FLNG, XLE, APA, CNQ, CVX, ENB, PXD — etc.
- PANW
- AMGN
- ABC
- UNH
- VRTX
Economic Calendar
As we all know, there’s no crystal ball when it comes to trading stocks, options, or futures. But the Market Imbalance Meter may be as close as it comes. Knowing how the “Big Money” is placing its bets can give our trading room a big wave to ride — or a warning sign to stay out of the water. Come check it out now, risk-free for 30 days.
Comments are closed