The Opening Print Recap
After closing at 4681 on Friday, the ES rallied another 16.50 points up to 4697.50 on Globex. On Monday’s open, the ES traded up to 4592.75 and then dropped down to 4681 at 9:52. What did we say in yesterday’s Opening Print?
“Sell the early rallies and buy the pullbacks. As bullish as everyone seemingly became on Friday afternoon, keep in mind that the trend over the last week was to sell the early rallies in the ES.”
After the low, the ES bounced back up to the 4690 level then dropped 10 points back down to 4680. Following a small rally, a decent-sized sell program hit, pushing the ES all the way down to 4667 at 11:46. After the ES rallied 13 points up to 4680 — please note how key this level becomes throughout the day — it then chopped around before dropping to 4670.
The ES traded back to 4679.25 and then backed off down to ~4675 before upticking to ~4680 — two ticks below the VWAP going into 3:30 as the MIM showed $289 million to sell. Again, note how critical 4680 has been.
The ES traded 4671.50 as the final 3:50 cash imbalance showed $735 million to sell, rallied up to 4681.75 going into the 4:00 cash close and settled at 4681 on the 5:00 futures close, essentially flat from Friday.
In the End
In the end, the ES rallied on the open and sold off. In terms of the ES’s overall tone, both the ES and the NQ were weak but more so on the tech side. Further, the futures had a difficult time holding the rallies. In terms of the ES’s overall trade, volume was low with 151,000 contracts trading on Globex and 940,000 contracts trading on the day session, for a grand total of 1.09 million contracts traded.
Our View
For months, every time I looked at gold it’s been under $1,800. It’s been a very neglected commodity — but not now. Remember, we flagged gold as a buying opportunity earlier this month when it was trading near $1,795 an ounce. It’s been ripping higher since.
The move in gold is tied to higher inflation. Last week, “real yields” — which are directly linked to inflation — fell to some of the lowest levels on record, while the 10-year note fell to a low of 1.2%. It’s simple: Negative yields mean purchasing power of money invested declines over the lifetime of those bonds and with inflation at a 31-year high, investors start looking for protection from the higher cost of goods and services.
Bottom line: Historically, gold has been an excellent hedge against inflation, because its price tends to rise when the cost of living increases, and clearly, that’s been going up. It’s also a great way to diversify what could be a very shaky new year.
I really do not know anything more than you do, but I think inflation is going to really heat up and there is not one thing the Fed can do about it. I went to Costco a few days ago. There were clear shortages of some products and skirt steak has gone from $8.00 a pound to a hair shy of $16 a pound. My concern is a shortage of natural gas and some severe weather conditions that could slow food and medicine deliveries and cause a run on grocery stores.
I don’t think we should forget crude oil either, which was trading around $41 right around this time last year. There is no doubt the stock market is ignoring the obvious, but as long as the printing presses are running, the stock market will continue going for the ride.
For weeks the PitBull has been saying the markets can’t keep going up and that there will be a big letdown at some point, but he doesn’t know if it’s coming today or in three months. I have a lot of respect for him but I don’t think that way. I think there is a potential melt-up on the horizon.
Our Lean
Our Lean: I didn’t sell the early rally but I did buy the pullback. The reason I didn’t sell the early rally is that I have a hard time switching gears, going from short and flipping to get long — especially when looking at the market with a bit longer time horizon in mind.
Not that I don’t trade the two-way action when it’s in play, but I want to stick with the trend right now. I also want to keep it front and center in my mind that the markets are going up.
Yesterday I did my own study of the monthly S&P cash studies. I went back 15 years and laid out the stats and from the day after Thanksgiving to Christmas and there is an exceptionally high level of up-days. I think this will lead to what I call “mini melt-ups.”
I want to look at the $2,150 Feb gold calls and the January 2022 ES 5050 calls for my year-end “lottos.”
Our lean is for higher prices. I think there will be two-way price action again, but I’m going to add to my longs on any 15 to 20-handle pullbacks. I also think an ES close above 4686 will lead to 4720 then 4760. As always, use protective stops. Sometimes a good out can be just as good as a good in.
As we all know, there’s no crystal ball when it comes to trading stocks, options, or futures. But the Market Imbalance Meter may be as close as it comes. Knowing how the “Big Money” is placing its bets can give our trading room a big wave to ride — or a warning sign to stay out of the water. Come check it out now, risk-free for 30 days.
Danny mentioned two things in the above section. The first was the significance of 4,680 in the ES. The other was gold. Let’s look at both.
Starting with 4680 on the ES Futures.
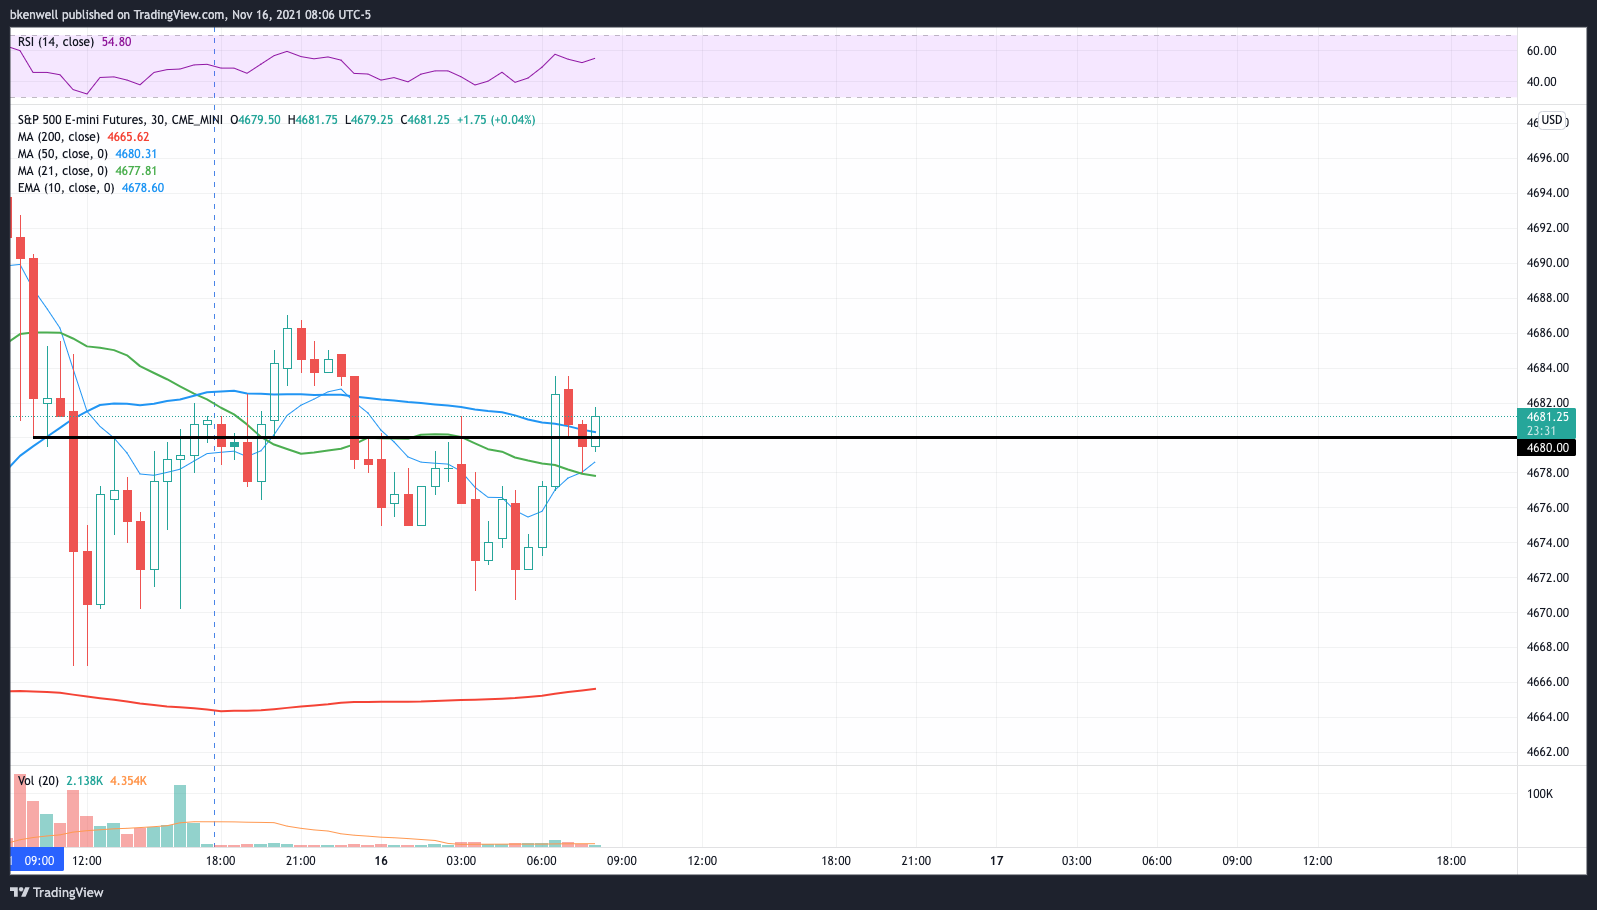
The chart above captures the 9:30 open through about 8:00 ET on Tuesday morning. While the ES has spent time above and below 4680, you can see how it was pinballing around this mark.
Above it now in Globex — albeit, barely — let’s see if the ES can build above this measure. Here’s how I’m looking at it now.
The ES has cleared the minor downtrend mark on the 30-minute chart. Now I want to see if it can rotate above the Globex high at 4687. If it can do that, yesterday’s high is in play at 4697.50.

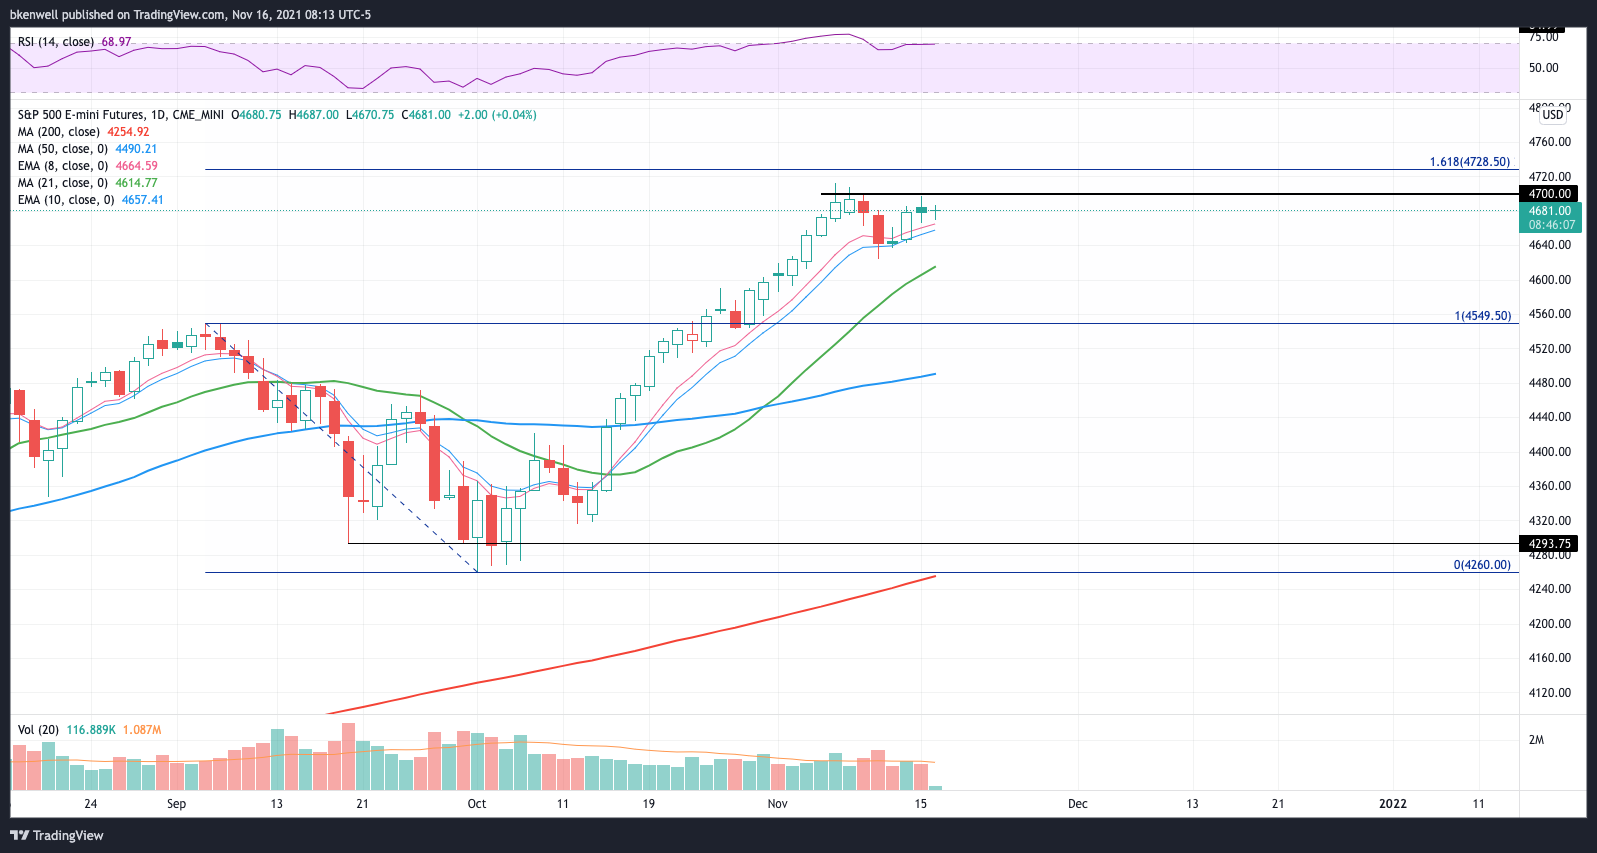
Finally, here’s a look at the daily.
Remember, 4700 has been a tough nut to crack. While we have traded above it, we have not closed above this mark and yesterday’s rejection only serves as a reminder that this area is significant.
If the ES can break over 4700 — and more importantly, close above it — then we could be on track for a push to the 4725 to 4730 area.
On the downside, last week’s low at 4625 is the spot to watch. Remember, we had an inside week last week.
For now, the lean stays bullish with the ES over all of its short- and long-term moving averages. But should we see a weekly-down rotation, it must be respected. Until then, we are looking for opportunities on the long side.
Keep in mind, we have a lot of Fed speakers the next few days (see “Econ” below).
Gold
As for gold, we got bullish on the yellow metal at $1795 an ounce (as linked above). Others may have waited for a daily-up rotation at that point at roughly $1800 an ounce and that’s fine too. Either way, this trade has paid out more than $75 an ounce, which is no laughing matter with the futures contracts.
Investors can also be long physical gold or the GLD ETF if they prefer.

However, we do have some adjustments from here on our trade. There are too many traders who read The Opening Print with too many of their own strategies, so we simply lay out the idea and the execution is up to the trader.
In our case, we do like to trim and raise our stops — and there is nothing wrong with other traders doing the same thing. Gold continues to build nicely above $1850 after it went monthly- and quarterly-up over $1815 and $1837.50, respectively.
From here, the next target is technically the Q2 high at ~$1919, but that target can be adjusted to anywhere from $1899 to $1919. Above $1920 and technically the doors are opened for the $1950 to $1960 area.
On the downside, keep a close eye on the 8/10-day moving averages, as well as the Q3 high/rotation point near $1837. A pullback to these measures that finds support is a possible buying opportunity.
Home Depot

Today seems like a good day to focus on some of the broader plays in the market. However, retail stocks are jumping out to me on earnings.
Starting with Home Depot, the company reported pretty solid results. But it’s only up about 1.2% to $375.50 in pre-market trading. Be wary of a fade from this area, which has been resistance for almost a month.
A clean break over this mark could put HD on pace to climb to the $390 to $393 area. On the downside, we need to see support come into play between $365 and $369-ish.
Walmart
Walmart is in a similar situation. It delivered a beat-and-raise quarter, but it’s initial 2% pre-market gain has been losing steam.
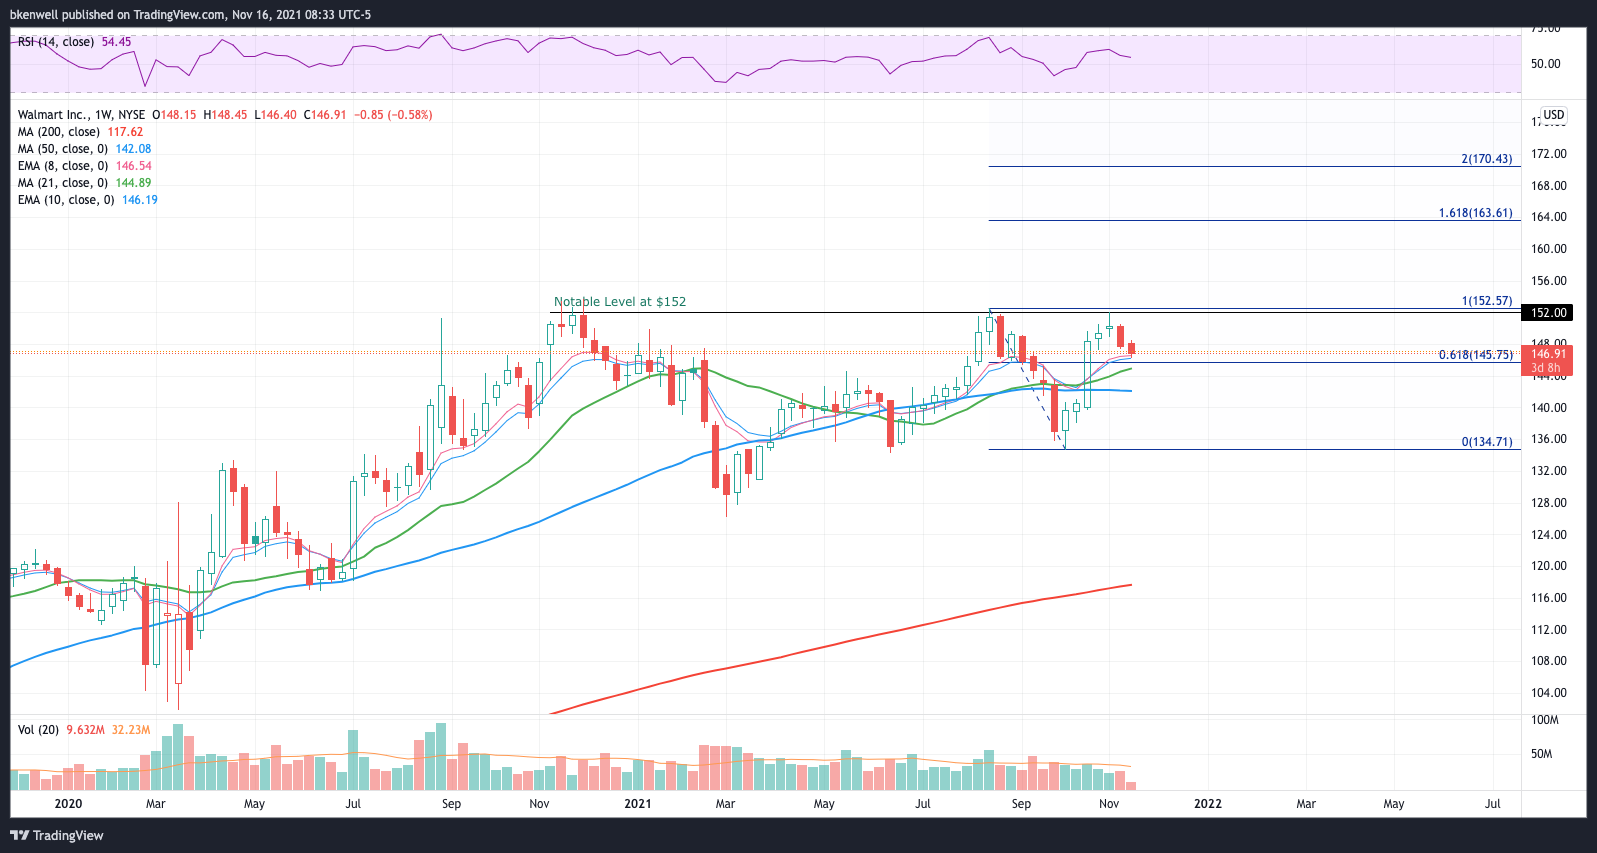
Daily-up back over ~$148.50 can give the stock some momentum and put WMT back over the 21-day and 10-day moving averages. Back above its short-term moving averages can give it life, but I think what bulls really want is a weekly-up rotation over $150.50.
That would have the key $152 to $152.50 area on deck. This zone was resistance in Q4 2020, August 2021, and again just a few weeks ago. Each fade was resistance.
Additionally, the stock traded down into the 10-week moving average with Monday’s dip. It doesn’t have the cleanest chart setup, but to see WMT hold here and rotate higher would be bullish, especially if we can get the $152 breakout. That could put $160 to $163 in play.
Failure to hold $145.75 on the downside could put further selling pressure in play.
Disclaimer: Charts and analyses are for discussion and education purposes only. I am not a financial advisor, do not give financial advice and am not recommending the buying or selling of any security.
Remember: Not all setups will trigger. Not all setups will be profitable. Not all setups should be taken. These are simply the setups that I have put together for years on my own and what I watch as part of my own “game plan” coming into each day. Good luck!
Economic Outlook

Comments are closed