Our View
There are a few very good traders that do not think Santa is coming next week and they say the S&P is going down hard during the last week of the year. You know what? When it comes to trading the ES, you should always expect the unexpected.
Nothing good comes without some pain. I am going to keep this light. We fought to try and maintain longs when the Covid headlines hit and if you survived, I think you just let this play out.
Our Lean
The total big board volume was only 801 million shares and S&P futures volume fell to 1.07 million from 2.6 million a week ago. Yesterday’s late rally was a perfect combination of the seasonalities with “thin to win,” which we talked about earlier this week.
Our lean is to buy the 20- to 40-handle pullbacks. If the ES can close above 4730, I think it’s a straight shot to 4800+.
Daily Recap
The ES traded up to 4646 on Globex and sold off down to 4626, opening Wednesday’s regular session at 4637.75. From there it jumped up to 4648 and after the push, the ES pulled back to the 4640 area. The low came just a few points lower, at 4635.50.
That ended up being the session low too, as the S&P ripped off eight straight higher closes on the 30-minute chart.
On my chart from the day low to the 4678.50 high, the ES made 17 separate highs. With the exception of a few minor pullbacks, the ES went straight up.
After the high, the ES sold off to 4661.75 at 2:30 and slowly rallied back up to 4676.75 at 3:17. From there it pulled back to 4670.25, and then several small buy programs pushed the ES up into the buy stops above 4677.75, sending it all the way up to a new high at 4687.50 at 3:58 after the MIM flipped from $66 million to sell to $800 million to buy.
On the 4:00 cash close, the ES traded 4686 and after 4:00 the futures rallied up to another new high at 4690 before settling at 4698.25 on the 5:00 futures close, up 48 points or +1.05% on the day.
In the End
In the end, it’s quite simple, I thought we would pull back, and instead the ES went straight up. In terms of the ES overall tone, it was firm. In terms of the day’s overall trade, 1.07 million contracts were traded.
As we all know, there’s no crystal ball when it comes to trading stocks, options, or futures. But the Market Imbalance Meter may be as close as it comes. Knowing how the “Big Money” is placing its bets can give our trading room a big wave to ride — or a warning sign to stay out of the water. Come check it out now, risk-free for 30 days.
Technical Breakdown
- NYSE Breadth: 76% upside volume
- NASDAQ Breadth: 66% upside volume
We had a decent day of breadth in the market, no doubt in thanks to the light volume we’re seeing ahead of the holidays. The markets made their morning move, then trended that way for most of the session.
My piece today is short and sweet.
It’s been a pleasure trading with you this month, and overall, I think we handled this month’s turbulence pretty well. We still have one week to go, but our “less is more” approach through the first half of December gave us the mental and fiscal firepower to really take advantage of the opportunities over the last week or two.
Remember, you don’t have to trade every day, all the time. Just one quality trade a day or a few per week can generate terrific results.
The Game Plan
We’re in one of those times where “proper trading” is rewarded. Meaning, proper entries, patience, and position size are paying dividends, while sloppy trading — essentially the opposite of all of those observations — is being punished.
“But isn’t it always like that?”
No. There are many times where sloppy trading goes unpunished, lulling traders into a false sense of security (usually during market-trend environments) before shifting gears and making them pay later.
For instance, our trades in PG, UNH, CGC, AAPL, ABBV, and PFE have all been winners this week. We timed them right and worked them methodically with the flow of the market.
With Tesla, you may remember yesterday’s lesson about the stock. That is what I mean by “sloppy” vs. “proper” trading.
S&P 500

There’s not much left to talk about here. It’s the last trading day of the week, with markets closed on Friday, Dec. 24 — (Here’s the full schedule).
The main level in the S&P index is 4718 to 4720 on the upside.
The downside is 4665, followed by the 10-day and 21-day moving averages.
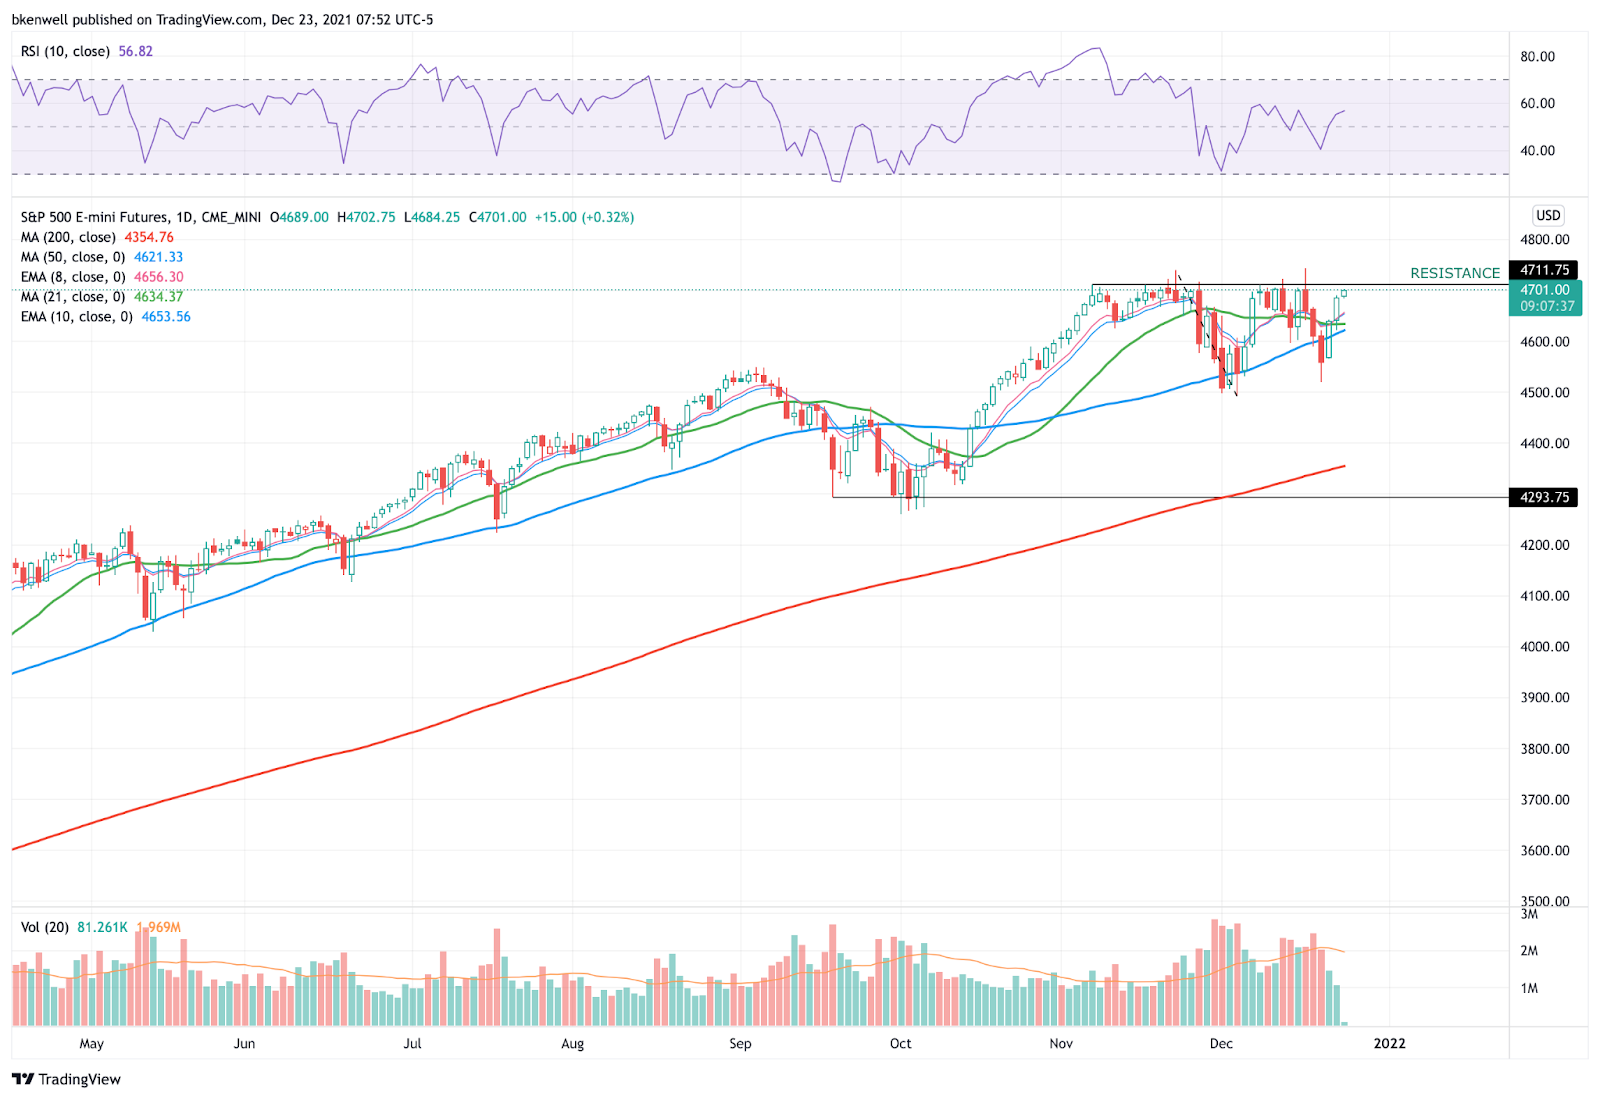
For the ES, the upside level is 4712. The downside level is the 10-day, followed by the 21-day and 50-day junction.
Individual Stocks
I am not looking for anything new to put on today. I love the holidays and spending time with the family and I don’t want to ruin any of that with some sour trades after a great three-day stretch.
I’ll likely look to trim some of the longs we have accumulated for this week if we get a decent opening push.
Next week is historically a good stretch for the markets. That’s the traditional Santa Claus rally. Over the last 19 years, the SPY has been up 70% of the time for the last week of the year. Same with the QQQ.
Disclaimer: Charts and analyses are for discussion and education purposes only. I am not a financial advisor, do not give financial advice, and am not recommending the buying or selling of any security.
Remember: Not all setups will trigger. Not all setups will be profitable. Not all setups should be taken. These are simply the setups that I have put together for years on my own and what I watch as part of my own “game plan” coming into each day. Good luck!
Economic Outook
Economic Outlook

Comments are closed