No Rest For The Weary
It’s hard to overlook the obvious. The tech-heavy Nasdaq fell 4% on Friday, 13% in April, and is 21% in 2022 — its worst start to a year on record and its worst showing since October 2008.
The S&P closed out April with four consecutive weekly declines and fell 8.8% in the month, bringing its year-to-date losses to 13%. And the Dow which, was supposed to be up an average of 2% in April, fell 4.9% on the month and is down more than 9% this year.
Both indexes logged their worst months since March 2020. Last Monday’s Opening Print laid out the entire week:
I learned this from the PitBull and now you are going to learn it from me: The S&P rallies early in the week and early in the day in a bear market. We saw this play out last week, with Monday’s flat session and the rally on Tuesday.
Like the markets or hate them, there is no denying that they are in trouble. After selling off all day on Friday, the MIM delivered a 1-2 punch on Friday’s close with a $5.4 billion sell imbalance that sent the ES tumbling. We see a lot of $1 billion to $2.5 billion dollar sell imbalances, but $5.4 billion is huge and coincides with last week’s non-stop liquidation.
The bulls will hate hearing this, but we have to indoctrinate ourselves into thinking “lower prices.” That also includes not falling in love with any rallies.
The best six months for stocks end this week. Some think there could be some end-of-the-month buying and I can’t disagree, but it doesn’t matter if it rallies for one hour or five days, it’s eventually going to be a sale.
It’s hard to sell the ES after such a big drop. The algorithms and HFT programs live off of “overly” long or overly short positions in the index futures market and the build-up of buy and sell stops — think of a stretching rubber band.
Right now the crowd is short and with the nearby stops being on the upside, I don’t think a pop can be ruled out. Still, this is a sell-the-rallies market. The levels we are focusing on are Friday’s close at 4247, the 4255 to 4260 zone, and the 4265 level. Bears are looking at 4150 to 4165 on the downside.

There is an old saying that if you want to know where the S&P is going, you have to “follow the money” and that is what the MrTopStep Imbalance Meter does.
Over the last four months — and especially over the last two weeks — the MIM has sold billions in stock and the S&P has acted accordingly. As the MIM showed more sell imbalances, the markets continued lower.
We can bounce in the short-term, but from a “big picture view,” this selloff is far from over and the No. 1 indicator for tracking money flows is the MIM. Traders can believe what they like, but the real reason the S&P fell so hard Friday was because of the $7.16 billion in stock sold on the close.
It’s really as simple as that.
Our View
It’s going to be a busy week. According to FactSet, nearly a third of the S&P 500 reports earnings this week. In addition to a tidal wave of companies reporting, the Fed is set to raise interest rates by .50% during its two-day meeting starting Tuesday.
When the ES futures fall hard late in the day — as they did on Friday — they usually rally on Globex. Additionally, with so many global markets closed today, how will it affect an oversold S&P on the first trading day of May?
Seasonally, the first day of May is a bullish day for stocks, which has the S&P up on 17 of the last 24 occasions.
I think it’s important to stay on the ball over the next couple of months. They say “cash is king” and I think it is.
Our Lean
If the ES gaps below Friday’s low, I think the ES will run into a powder keg of sell stops. As I mentioned in prior Opening Prints last week, the 4120 level is key. While I think the ES is eventually going a lot lower, the stats are positive today, the crowd is short and volume should drop due to the Mayday Holiday.
The ES has also fallen 175 points from Thursday’s high to Friday’s close. It should be a quieter trading session and while we cannot rule out another fall, it’s our guess that the ES will level off at some point and bounce.
The levels we are looking at are 4100 and 4119 on the downside. On the upside, they are 4150 to 4160 and 4200. The Technical Edge section below breaks down why.
Daily Recap
We’re keeping it short due to the longer introduction today, but in the end, you can blame Friday’s selloff on Amazon all you want, but these markets have been gearing up for a downside flush for weeks.
In terms of the ES’s overall tone, there is bad and then there is horrible and Friday was the latter. In terms of ES’s overall trade, volume was big early in that day and kept building as the markets fell, with a total of 2.11 million contracts traded.
- Total Range: 161 points
- H: 4279.75
- L: 4118.75
Technical Edge
- NYSE Breadth: 85% Downside Volume (!)
- 4th Downside day of 80%+ in the last seven sessions
- Back-to-Back weeks of 80%+ downside volume
- NASDAQ Breadth: 78% Downside Volume
- VIX: ~$34
On Friday we wrote: “Despite a faster tape, we have been moving slower and that’s really important right now.”
By cutting down our position size and reducing our overnight exposure, we are keeping our stress down in what has become a very difficult tape.
The last time we had back-to-back weeks of 80%+ downside volume on the NYSE was January 2020. It was followed by a 5.5% bounce in the S&P to all-time highs. The only other time we saw this observation over the last ten years was in Q4 2018 and there were actually three straight weeks of 80%+ downside volume, but it eventually led to the bottom.
As you can see, it’s not very common.
Game Plan
We have a mild gap down on Monday morning following a brutal, 85% downside day on Friday. Can we gap-down and bounce?
S&P 500

One scenario playing out in my head is reminiscent of the action in March, where the market declined into the Fed, then surged after the rate hike news. After so much downside lately, we now have to wonder if that action is close to being finished.
I am really only watching two levels: 4119 and 4100.
The first is last week’s low and the second is the 2022 low. I want to see how the ES handles these levels and if we break below them, can they be reclaimed? If so, it could give us some type of bounce where we can at least measure our risk against the low.
If the ES breaks these lows, but bounces, clears 4119 and starts to run, 4150 to 4160 is my next upside target. Above that could open the door up toward 4200.
SPY

The $410 to $411 is key here. If it breaks, can bulls reclaim it and get a rally going? That’s what I’ll be watching today — as the first trading day of May is historically bullish.
TLT

We hit our next trim zone on Friday’s gap-down open.
Now moving lower again, we’re in ⅓ to ½ position. Traders can look to exit fully or again reduce the position as we retest the April low in the pre-market.
Those who want to leave on a few runners can look for a potential dip into the $116s.
Individual Stock Trades — PG, DOW
- Keeping our individual stock names quite limited when VIX is $30+ and as you know, it’s $34+ right now. Very difficult environment for individual stocks.
PG

Still watching PG for a potential weekly-up rotation.
DOW
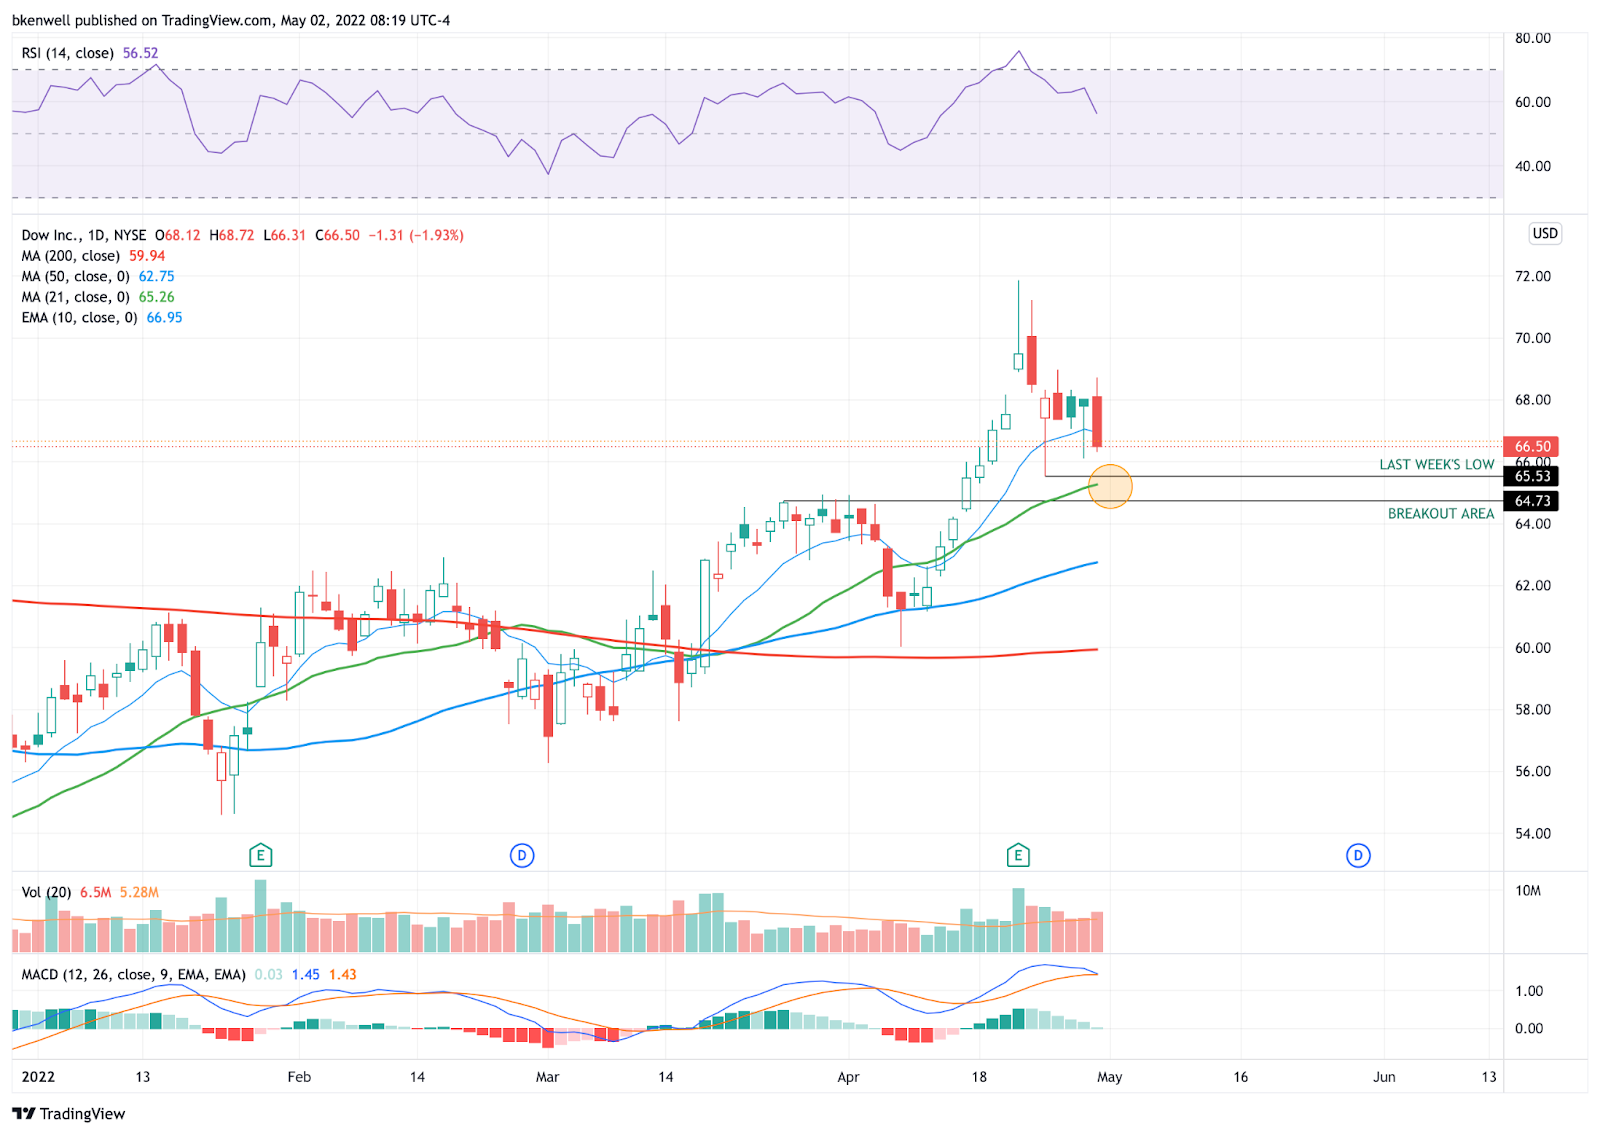
The daily-up didn’t stick with DOW on Friday, which is no surprise given the market action.
If it dips further, I want to know if we can get a test of the breakout zone, last week’s low, and the 21-day SMA, in the $64.75 to $65.50 area.
Holding the low end of that range will be key for our risk management if this scenario plays out.
Go-To Watchlist
*Feel free to build your own trades off these relative strength leaders*
Numbered are the ones I’m watching most closely. Bold are the trades with recent updates.
A huge number of our B/E stops were hit last week, leaving us with virtually no trades left on the books. Some runners may be in play with WMT and TGT.
- TLT — second trim spot hit, down to ⅓ or ½ position and B/E stop → Looking for $118.70 trim zone, then potentially $116 to 116.50-ish.
- WMT — Trim at $158 → B/E Stop.
Relative strength leaders (List is cleaned up and shorter!) →
- AR
- WMT
- PEP
- KO
- MCK
- BMY
- JNJ
- DLTR
- DOW
- VRTX
- XLP — Consumer Staples
- PG
- COST
- MAR
- PANW
Economic Calendar

As we all know, there’s no crystal ball when it comes to trading stocks, options, or futures. But the Market Imbalance Meter may be as close as it comes. Knowing how the “Big Money” is placing its bets can give our trading room a big wave to ride — or a warning sign to stay out of the water. Come check it out now, risk-free for 30 days.
Comments are closed