Our View – Uncertainty
The S&P hates uncertainty and currently, there is an abundance of it. For years, investors didn’t have to worry about interest rates, but the 10-year yield just hit 3% for the first time since 2018. However, the uncertainty doesn’t stop there. Monetary policy, inflation, and geopolitics are all part of the landscape. When there were zero borrowing costs, every dip was being bought — whether it was 2% or 10% — and now instead of seeing buying, we are seeing mass liquidation. How bad is it?
- Yesterday the S&P fell to its lowest intraday level since May 2021.
- The S&P has been down 4 weeks in a row.
- According to Dow Jones Market Data the S&P 500, which is down 13% so far this year, has had its worst start to a year since 1939.
Today starts the first day of the Federal Reserve’s May policy meeting and we’re hoping to clear up some of this uncertainty. The public knows there’s a high probability the Fed will raise interest rates by .50% tomorrow. However, clarity around unwinding its balance sheet will be in focus.
Yes, the markets are rallying…and they should! The rate hike has already been priced in at this point.
Our Lean
There is a lot of hurt going on out there and there doesn’t seem like there is much let up. Some people think things will get better in the next six months and others say a few years. Then some investors are saying this could be a multi-year selloff. Right now I am just trying to gauge how the S&P and Nasdaq are going to react to an 0.50% rate hike.
My answer? Well, that depends on how much it rallies into the 2:00 pm ET event.
Yesterday’s $2.7 billion buy imbalance makes perfect sense. It was the first trading day of May and everyone was short going into the Fed meeting. It’s why we can look for pops despite being somewhat pessimistic. Yesterday we said:
“While I think the ES is eventually going a lot lower, the stats are positive today, the crowd is short and volume should drop due to the Mayday Holiday.”
Recently, after the ES rallies hard it tends to follow through to the upside on the open the next day, which has been a really good selling opportunity around the open or on the first real early rally and be patient — it could be a 30 point drop or 60 — and buy the dip.
This is not a bullish endorsement, it’s just riding a dead-cat bounce to ultimately get short into.
Daily Recap
The ES traded opened Monday’s regular session at 4126.25 and began moving lower. It undercut the 2002 low near 4101, found a low at 4098, then rocketed higher. At 10:32, the ES topped out at ~4166 and then went “offered.” It was a huge rip for anyone that was looking to get long on an undercut of the prior 2022 low.
After a few lower highs, the ES sold back off down to 4105 at 11:32 and back up to 4124.25 at 11:37. This was roughly the range for the next few hours until support gave way and the ES traded down to a new low at 4075 at 1:55. After it quickly rallied back up to 4094, it dropped ~30 points down to 4063.25 at 2:21, down about 1.68% on the day. Then the jets came on.
The ES dropped down to 4065.50 at 2:59 and traded 4145 at 3:35, an 89-point rally in just over 30 minutes. The ES traded 4142.50 as the 3:50 cash imbalance showed $2.7 billion to buy, traded up to 4151.75 at 3:56 — up almost 100 from the low. Ultimately, the ES gained 23.50 points or 0.57% on the day.
In the end, it was a one-way street down and a one-way street back up. In terms of the ES’s overall tone it was weak all day until the 2:45 buy programs started hitting. In terms of the ES’s overall trade, volume was strong at 2.26 million contracts traded.
- Total Range: 109.75 points
- H: 4165.75
- L: 4056
Technical Edge
- NYSE Breadth: 56.8% Upside Volume
- Back-to-Back weeks of 80%+ downside volume
- NASDAQ Breadth: 71.2% Upside Volume
- VIX: ~$32.50
“Can we gap-down and bounce?”
That was our approach to the market yesterday and it’s ultimately what we got. The market gave us a quick bounce after breaking the prior 2022 low and resumed its move lower until later in the afternoon when it rallied again.
The question I now have is, “can we bounce post-Fed” knowing that the 50 bps rate hike has been well-telegraphed.
Game Plan — S&P, Nasdaq, Bonds, Individual Stocks
- I do not typically like individual stock trades with the VIX above $30. However, a few stocks warrant an extra look even though prior relative strength stocks seem to be rotating lower (making us wonder if we’re about to see a rotation into tech and a subsequent bounce). Either way, check out these names, and if you like the setups, consider a smaller trade size than usual.
S&P 500

In yesterday’s session, we broke last week’s low at ~4119 and the 2022 low at ~4101 but then reclaimed both.
In Globex, we took out Monday’s high at 4166 but are dropping back below it in the premarket. From here, the action is tricky with the Fed on tap tomorrow. Do we rally into the event? Stall? Selloff?
I don’t know.
If we break below last week’s low (4119) again, I’ll be somewhat cautious knowing that with a VIX above $30, we can flush back down toward the low. On the upside, watch Monday’s 4166 high. Above that could unlock more upside.
Specifically, it would put 4175 to 4180 in play, followed by 4210 and the 10-day.
I do feel like we can rally around the Fed, the question is when.
SPY
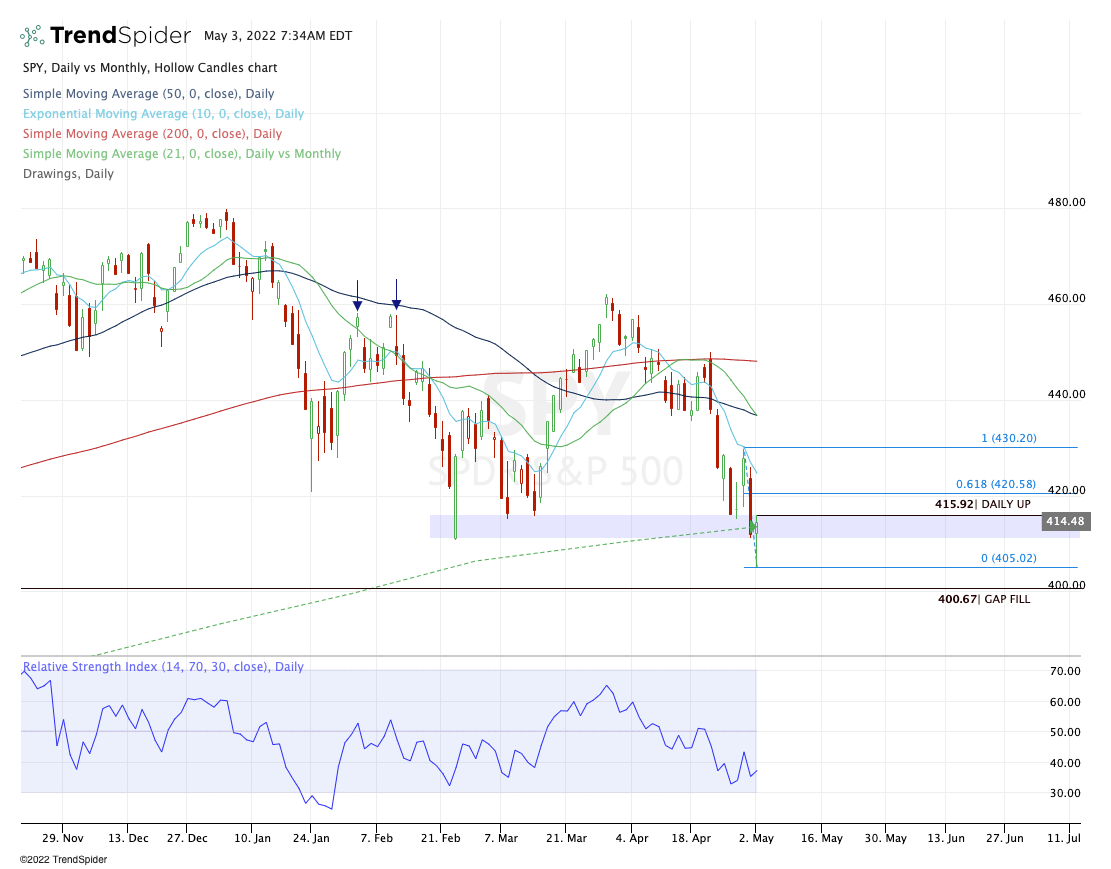
Down modestly in the premarket now, that’s honestly my preferred beginning to the day. If we go red-to-green and erase the opening morning dip, let’s see if the SPY can go daily-up over $416.
If it can, that could open the door to the $420 to $421 area, which is followed by the 10-day moving average.
On the downside, below $410 to $411 has us a bit more cautious.
Nasdaq — NQ

If the NQ can clear 13,085 and stay above it — Monday’s high — then the Globex high of 13,171 could be in play. Above that opens the door to the 10-day ema, which has been active resistance.
On the downside, be careful below 13K.
QQQ

Similar setup in QQQ. Daily-up over $318.75 could open the door up to the $322.50 area, followed by the 10-day.
Below $318 — like it is in the pre-market — and I am being a bit more cautious as it leaves last week’s low in play.
TLT

We only have a few runners left in TLT for our short now that it has rotated significantly lower.
Above is a longer term monthly view and as you can see, we could be coming into some sort of bounce area based on prior support and the rising 200-month moving average.
Individual Stock Trades — WMT & MCK
WMT — weekly

Huge winner for us previously, WMT tagged the 10-week ema and is working to reclaim the $152 to $152.50 breakout level. If it gains steam, the first target is $156.50 to $157, then $160.
On the downside, our risk is $150.
MCK — weekly
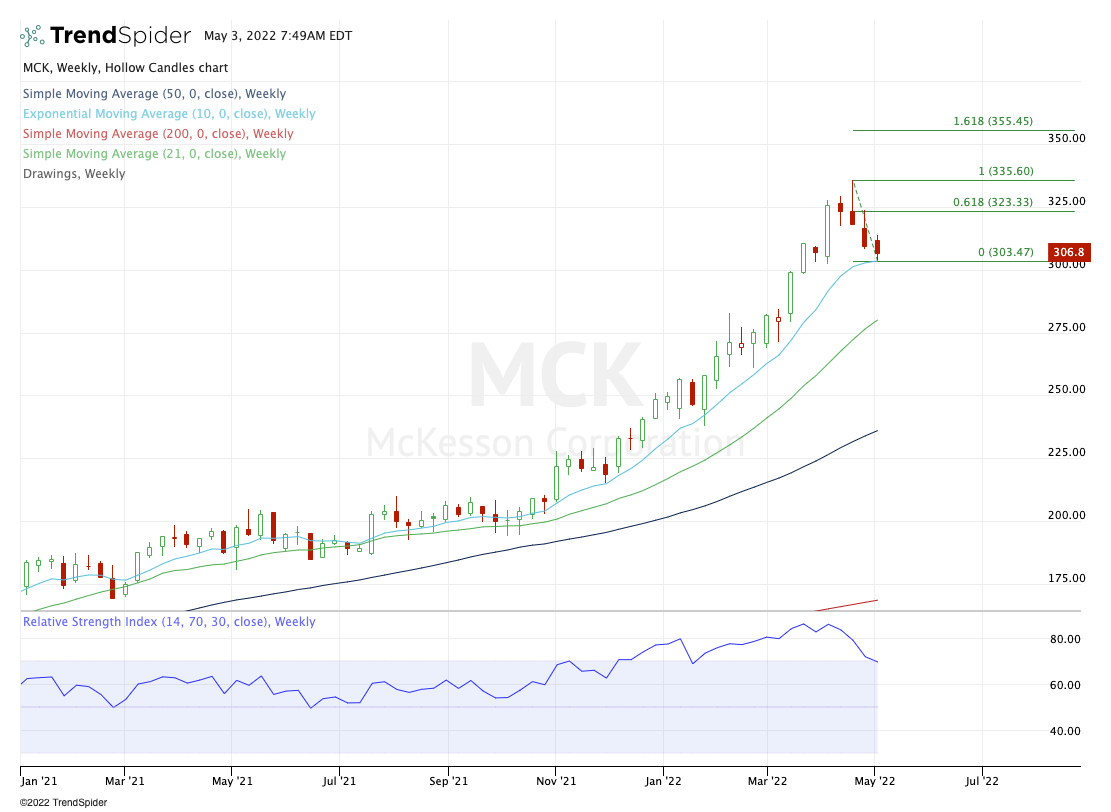
MCK has gone a long while without a tag of the 10-week and now we finally have it.
Our risk is below $303 — or for more aggressive traders, $300. On the upside, we’re looking for a bounce back up toward $320 to $325, although I’d be inclined to trim closer to the $320 area if we approach it.
Go-To Watchlist
*Feel free to build your own trades off these relative strength leaders*
Numbered are the ones I’m watching most closely. Bold are the trades with recent updates.
A huge number of our B/E stops were hit last week, leaving us with virtually no trades left on the books. Some runners may be in play with WMT and TGT.
- TLT — Just down to runners and B/E stop → Looking for $116 to 116.50-ish on the rest or a full exit by now is fine.
- WMT — Trim at $158 → B/E Stop.
Relative strength leaders (List is cleaned up and shorter!) →
- AR
- WMT
- PEP
- KO
- MCK
- BMY
- JNJ
- DLTR
- DOW
- VRTX
- XLP — Consumer Staples
- PG
- COST
- MAR
- PANW
Economic Calendar

As we all know, there’s no crystal ball when it comes to trading stocks, options, or futures. But the Market Imbalance Meter may be as close as it comes. Knowing how the “Big Money” is placing its bets can give our trading room a big wave to ride — or a warning sign to stay out of the water. Come check it out now, risk-free for 30 days.
Comments are closed