Our View
The Fed has been trouble for the S&P, but when the futures started to snap back after Powell’s Thursday morning comments, all I could think of was 4020. That’s as the S&P could have broken down, but it didn’t and the buyers came in.
Everything to do with trading the S&P can feel like a crap shot sometimes. You can have a great position on and in a matter of 5 minutes it’s a wipeout — welcome to 2022!
That said, all I was doing yesterday was looking for the PitBull’s Thursday/Friday low the week before the September Quad Witching, while paying attention to all the back-and-fill at ES 3900.
I knew the ES was oversold — and down 6/7 days, we all knew — and I knew there was monstrous short open interest in the ES and ESZ. When you throw in some lower volume and oodles of buy stops, the buy programs come rolling in.
I have to admit that all this chop can be painful, but I have done ok the last few days. I know at least a few of you have been to, with some messages and DMs rolling in. The levels have been pretty spot on and for that, we are quite pleased and quite thankful about navigating the short week. This type of stuff makes our week:


Our Lean
It’s FRYday and I am 100% sure it will live up to its reputation. Not many people were looking for upside, but yesterday I tweeted that 4040 was on tap for Friday.
With the ES gapping higher by almost 50 points, I’m looking to sell the early rally and buy the pullbacks. The ES may be going up, but who is to say it doesn’t trade 4000-3980 or lower first?
Lastly, I am really looking forward to seeing many of you during the Saturday 11:00 ET webinar. It’s free, and we have a lot of great speakers lined up!
Cheers everyone and have a great weekend.
Daily Recap

The ES sold off down to ~3970 on Globex and traded 3955 on Thursday’s regular session open. After the ECB raised its key interest rate by .75 points, the German DAX sold off 235 points and that’s when the ES started to weaken. The ES dipped to the 3942.75 level, then ripped 68 points up to 4010.75.
By noon, it had shed about 50 points, bottoming shortly after 12:20 near 3953 and 58 points off the high. Then the ES surged 48 points into the 1:30 high, with the subsequent 15 to 20 point moves highlighted above.
The ES traded 3989 as the 3:50 MIM showed $600 million for sale, then rallied up to a high of 4007 and traded 4005.75 on the 4:00 cash close. After 4:00, the ES traded up to 4011.50 and settled at 4010 on the 5:00 future close, up 25.50 points or 0.64% on the day.
In the end, it was all buy programs. In terms of the ES’s overall trade, it was firm. In terms of the ESs overall trade, volume was on the high side at 2.29 million contracts traded.
- Daily Range: 68.75 Points
- High: 4011.50
- Low: 3942.75
Technical Edge —
- NYSE Breadth: 70.5% Upside Volume
- NASDAQ Breadth: 60% Upside Volume
- VIX: ~$23
Game Plan: Bonds, Dollar S&P, Nasdaq
Not much to add other than yesterday’s rally was only mildly convincing, as the S&P sits at the 10-day/10-week/50-day moving average area, aka active resistance. It got there in a volatile session on mild upside breadth.
It would have been more convincing if the dollar continued to decline, if bonds hadn’t rolled over and closed at session lows, and if the breadth was better.
That said, we’re gapping up notably into the session, with bonds rallying and the dollar falling. That all sets the stage for a tricky trade and after a good week, I’m honestly in no hurry to do anything today or trade in large size. If that’s you too, feel free to take no trades on the day or walk away from the screens unless the setup is too attractive to ignore.
I’m inclined to sell the open/early rally given yesterday’s weak breadth, but “FryDay” gets its name for a reason.
Let’s look at the charts.
S&P 500 — ES

On the left is the daily chart, on the right is the weekly.
Notice on how the ES lost the 10-week moving average two weeks ago, then last week it was rejected by this measure. Now it’s again trying to regain this mark, but is stalling near that area now.
That said, it’s pushing above the 50-day as we speak.
Is it so hard to believe that we retest the 4025 to 4030 area? A full gap-fill puts 4011 on the table.
Whether we dip off the open or not, ~4100 is a notable area on the upside to keep an eye on (either today or early next week). That marks the 21-day moving average and the 50% retracement.
SPY
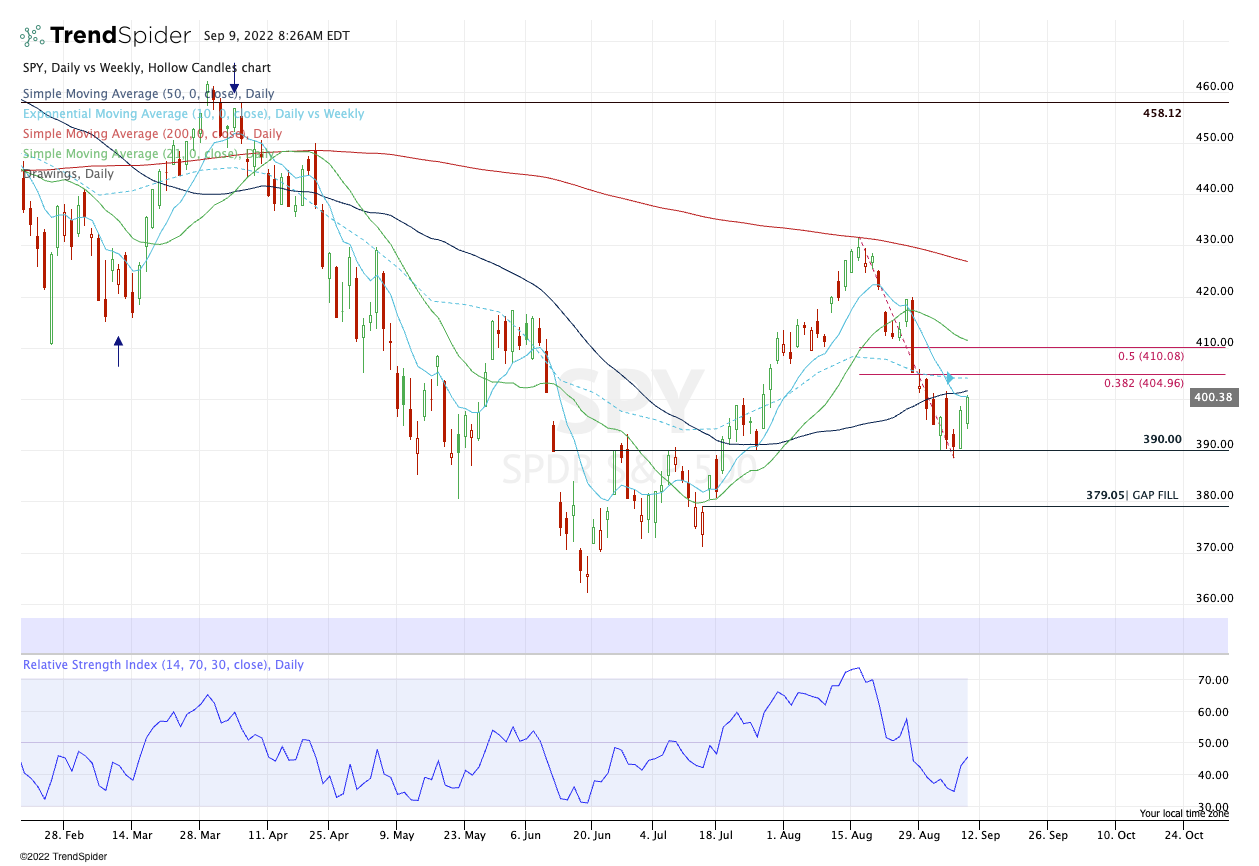
Yesterday, we called the $400 to $401 area a sell zone and it worked flawlessly, as the SPY tagged $400.86, then retreated to $395. The pullback just didn’t stick as the SPY then rebounded into the close.
Near $400 on the close and almost $404 in the pre-market, the setup is a little harder this morning.
If we see $404 to $405 on the opening gap-up, I may be so inclined to try a sale. That’s the 38.2% retracement and the 10-week moving average. If anything, it could be a cash flow trade and the SPY will either burst right through these levels (and we’re wrong with a small loss) or it will retreat and we’ll put a couple bucks in our pocket.
Nasdaq — NQ

“If the NQ can continue pushing, 12,375 could be in play (roughly the 10-day ema).”
Yesterday’s high? 12,379.
We’ve had a really great trade in the Nasdaq (NQ and QQQ) this week. So I’m not looking to push my luck, but keep a very close eye on the 12,570 to 12,600 area, which is the 50% retracement and the 50-day moving average.
Nasdaq — QQQ

Nothing convincing enough for a trade here, but the $306 area could be a reasonable sell zone if we see it. There we have the 50% retracement, as well as the 50-day and 10-week moving averages.
Ford

Ford on the weekly bull flag responding nicely off the 10-week moving average. I don’t have a specific trade setup this morning, but it’s definitely one to keep an eye on.
CHNG

A note is below on how to manage this one, but look at how well CHNG traded yesterday and has bucked the volatility in the overall market.
That’s why we sniff around for these Relative Strength setups. They tend perform the best in a bad tape.
Go-To Watchlist — Individual Stocks
*Feel free to build your own trades off these relative strength leaders*
- Numbered are the ones I’m watching most closely.
- Bold are the trades with recent updates.
- Italics show means the trade is closed.
For those that want to preserve their gains, feel free to exit any position below, as many are a ½ positions or less. However, these continue to hold up pretty well.
TMUS — many still waiting for tag of the 50-day and that’s fine.
LNG — I want to see ~$150
- UUP — Down to ¼ position as we hold for potentially higher prices. Raise stops to $28.40 to $28.50. Look for $30 on the last piece.
- TMUS — $147.50 high yesterday, got us down to a position size of ½ or ⅔. B/E Stops and and if at ⅔, can trim on any move above $148. Ideally looking for $149.75 to $150+ next.
- CHRW — I like the stop-loss at $111 to $111.40, for a very low-risk setup.
- Trim on any push up to $114.50, followed by $116+
- CHNG — Got our $25.50 upside target. Now back down to ⅓ or ½ position. B/E Stop and trim on this opening push to get down to just a few runners. #Kudos
- OXY — Got out add spot at $66 and now a little lower, unfortunately. I want to see this back above $66 ASAP, while a stop in the $63s is reasonable.
Relative strength leaders →
Man, Solar came to life yesterday didn’t it? Not surprising as these names litter our top 5.
Top:
- CAH
- TAN
- ENPH
- FSLR
- LNG — Looking for a retest of the $150 area!
- CNC
- F
- XLU
- XLE
- OXY
- BMRN
- PWR
- CHNG
- CELH
- COST
- UNH
Economic Calendar

As we all know, there’s no crystal ball when it comes to trading stocks, options, or futures. But the Market Imbalance Meter may be as close as it comes. Knowing how the “Big Money” is placing its bets can give our trading room a big wave to ride — or a warning sign to stay out of the water. Come check it out now, risk-free for 30 days.
Disclaimer: Charts and analysis are for discussion and education purposes only. I am not a financial advisor, do not give financial advice and am not recommending the buying or selling of any security.
Remember: Not all setups will trigger. Not all setups will be profitable. Not all setups should be taken. These are simply the setups that I have put together for years on my own and what I watch as part of my own “game plan” coming into each day. Good luck!
XXXXXXXX LAURA — END HERE XXXXXXXX
Update on a Few Individual Stock Trades
We’re getting pullbacks and price targets today in a bit of a mixed, bifurcated market with Opex looming tomorrow. In that sense, some of this disjointed action isn’t all that surprising.
Let’s look at some, though.
AR

For anyone who took the weekly-up setup in AR, I’m looking to trim ¼ at $42+ followed by $44 to $44.50.
On the downside, $39.50 is a reasonable stop.
LNG

Ring it, baby! Take the last ⅓ off here.
UUP

If you have not trimmed any UUP at all, I would be trimming some today.
Of course, it’s totally up to each individual trader and their risk tolerance and timeframe. My mapping is simply what I see on my charts. But I would be trimming a little today even as we rotate higher and clear the main moving averages.
APLS

Dipping right into the 10-day ema here, let’s see if it is support. I am long here with a half-sized position because of the low volume in this security (and thus potential for increased volatility).
Further, feel free to skip if it’s too low of volume for your trade parameters. I opted for the trade as it’s been a good 6+ week stretch for us and I’m going to push for more until the market shifts gears.
The higher R/R trade would be waiting for a dip to ~$60 but we may not get that.
Comments are closed